

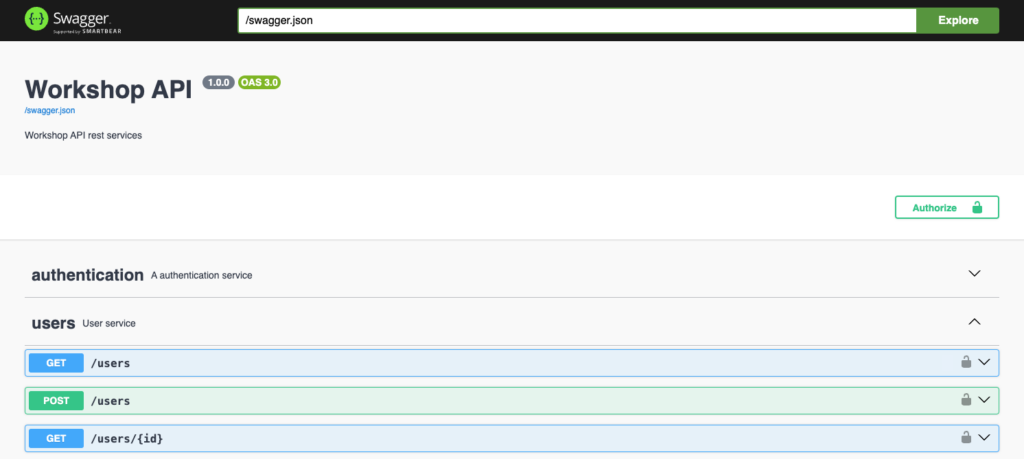
Yann Neuhaus

Manage Feathers.js authentication in Swagger UI
In addition to my previous articles Add a UI to explore the Feathers.js API and Add authentication in a Feathers.js REST API, today, I will explain how to manage Feathers.js authentication in Swagger UI and make it simple for our users.
After enabling authentication on API methods, as a result, using Swagger UI for testing is difficult, if not impossible. To solve this problem, Swagger needs to support authentication.
In this article, I will reuse the code from my previous articles.
First step: add authentication specifications to the applicationFor Swagger UI to handle API authentication, I need to update the specifications in the app.ts file. Therefore, in the specs object, I add the components and security parts:
app.configure(
  swagger({
    specs: {
      info: {
        title: 'Workshop API ',
        description: 'Workshop API rest services',
        version: '1.0.0'
      },
      components: {
        securitySchemes: {
          BearerAuth: {
            type: 'http',
            scheme: 'bearer',
          },
        },
      },
      security: [{ BearerAuth: [] }],
    },
    ui: swagger.swaggerUI({
      docsPath: '/docs',
    })
  })
)
This new configuration, general to the API, tells Swagger that authenticated methods will use a Bearer token.
Second step: define documentation for authentication methodsThe authentication service generated by the CLI does not contain any specifications for Swagger UI, which results in an error message being displayed on the interface. So I’m adding the specifications needed by Swagger to manage authentication methods:
export const authentication = (app: Application) => {
  const authentication = new AuthenticationService(app)

  authentication.register('jwt', new JWTStrategy())
  authentication.register('local', new LocalStrategy())

  // Swagger definition.
  authentication.docs = {
    idNames: {
      remove: 'accessToken',
    },
    idType: 'string',
    securities: ['remove', 'removeMulti'],
    multi: ['remove'],
    schemas: {
      authRequest: {
        type: 'object',
        properties: {
          strategy: { type: 'string' },
          email: { type: 'string' },
          password: { type: 'string' },
        },
      },
      authResult: {
        type: 'object',
        properties: {
          accessToken: { type: 'string' },
          authentication: {
            type: 'object',
            properties: {
              strategy: { type: 'string' },
            },
          },
          payload: {
            type: 'object',
            properties: {},
          },
          user: { $ref: '#/components/schemas/User' },
        },
      },
    },
    refs: {
      createRequest: 'authRequest',
      createResponse: 'authResult',
      removeResponse: 'authResult',
      removeMultiResponse: 'authResult',
    },
    operations: {
      remove: {
        description: 'Logout the current user',
        'parameters[0].description': 'accessToken of the current user',
      },
      removeMulti: {
        description: 'Logout the current user',
        parameters: [],
      },
    },
  };

  app.use('authentication', authentication)
}
The authentication.docs block defines how Swagger UI can interact with the authentication service.
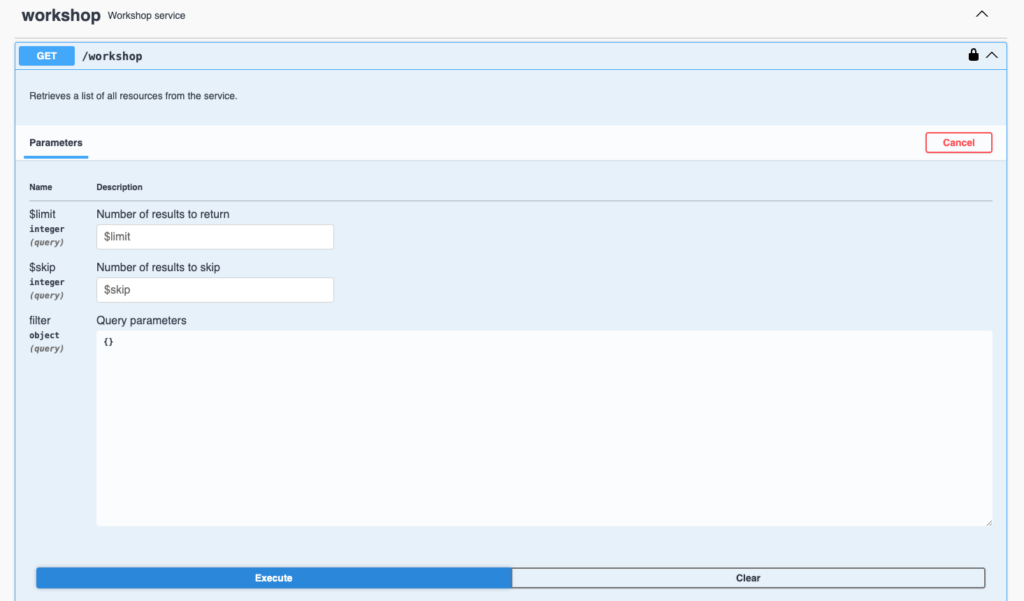
Third step: add the security config into the serviceAt the beginning of my service file (workshop.ts), in the docs definition, I add the list of methods that must be authenticated in the securities array:
docs: createSwaggerServiceOptions({
  schemas: {
    workshopSchema,
    workshopDataSchema,
    workshopPatchSchema,
    workshopQuerySchema
  },
  docs: {
      // any options for service.docs can be added here
      description: 'Workshop service',
      securities: ['find', 'get', 'create', 'update', 'patch', 'remove'],
}As a result of the configuration, new elements appear on the interface:
- The Authorize button at the top of the page
- Padlocks at the end of authenticated method lines
- A more complete definition of authentication service methods
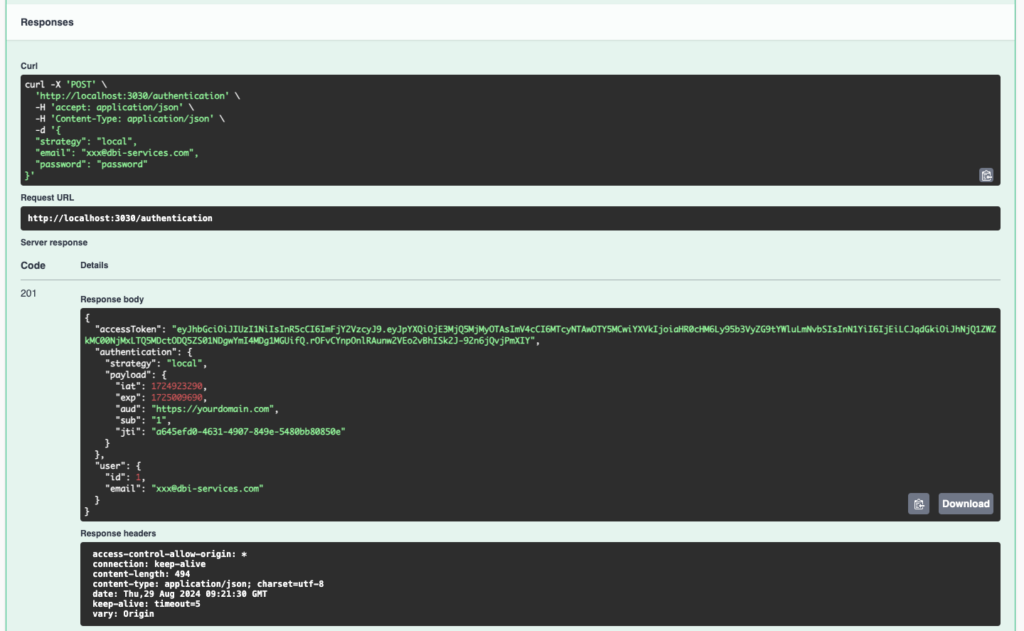
 Obtain an access token with the UI
First, I need to log in with my credentials to get a token. After that, the bearer token will be used in the next authenticated calls:
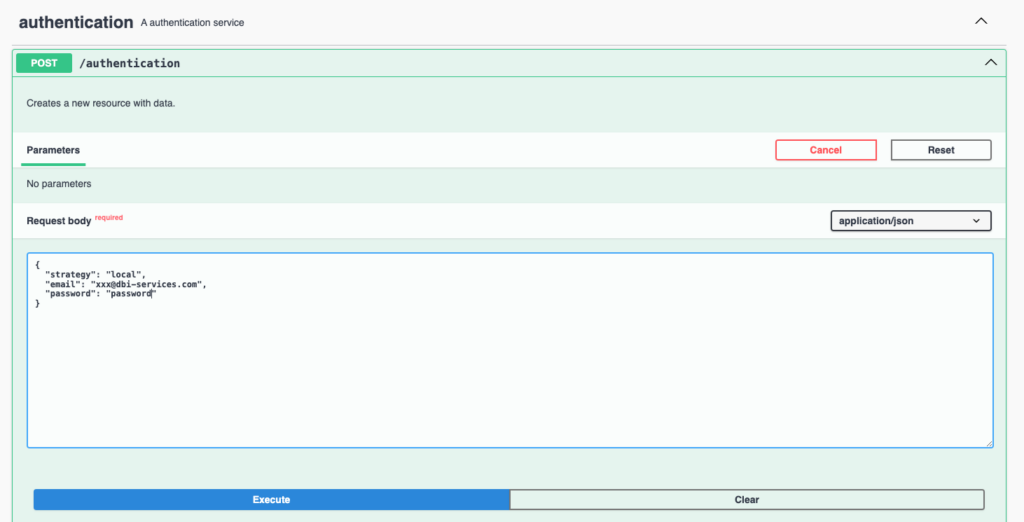
The JSON object sent in the request body contains the identification information. In return, we’ll get an accessToken useful for the next calls:
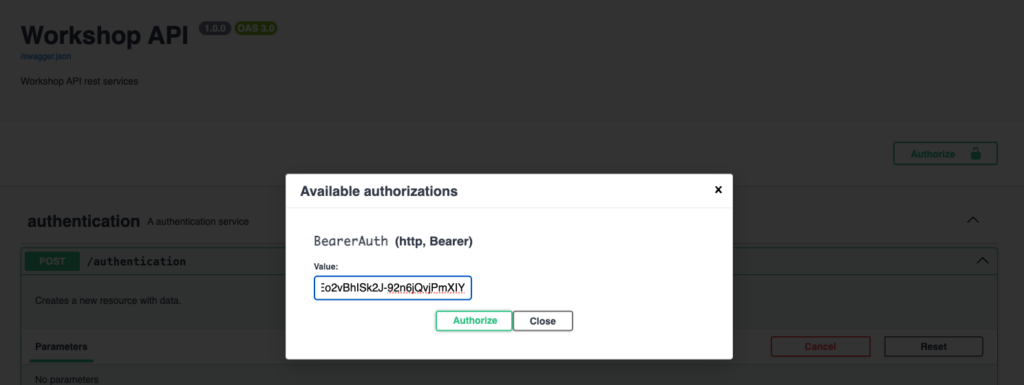
 Second step, define the bearer token for authenticated requests
Each call to an authenticated method requires the token to be sent in the http headers. We therefore register the token in Swagger UI by clicking on the Authorize button and paste the token obtained during the authentication step:
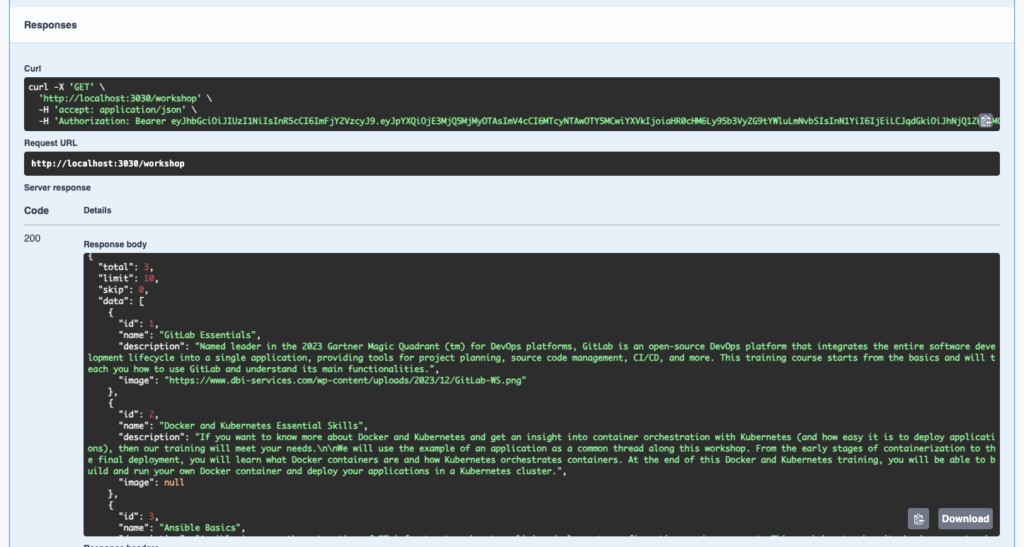
 Testing authenticated methods
Once the token has been entered into Swagger UI, I use the methods without worrying about authentication:
Swagger UI sends the token in the http headers to authenticate the request. Then the api returns the data:
 Conclusion
Managing Feathers.js authentication in Swagger UI is entirely possible. With a little extra configuration, it becomes easy to use authentication and authenticated methods. It’s even simple to test all API methods and document their use.
L’article Manage Feathers.js authentication in Swagger UI est apparu en premier sur dbi Blog.
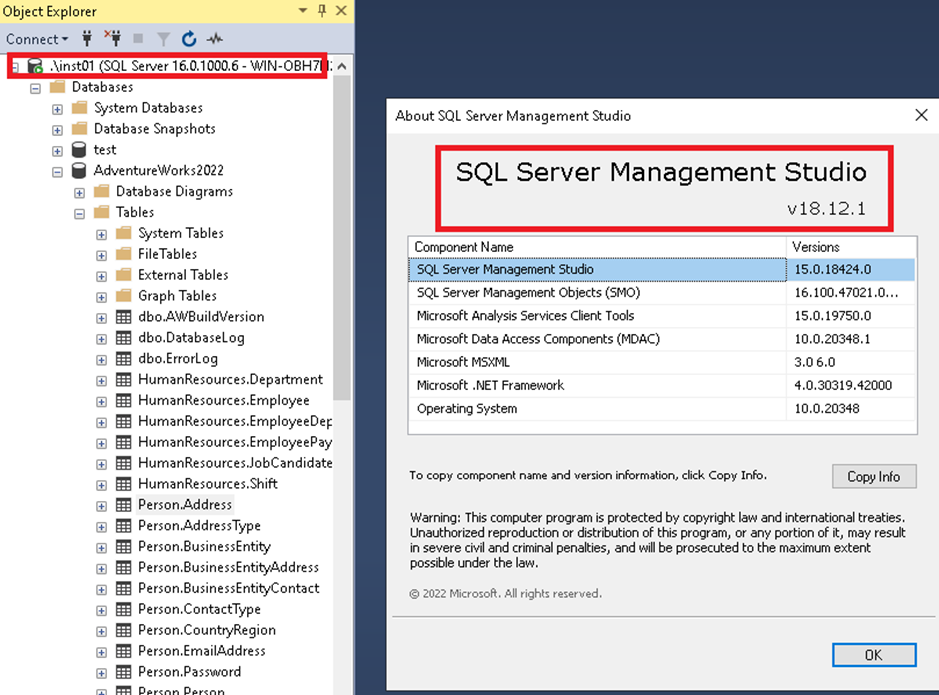
“Edit Top 200 rows” does not work between SSMS 18.12.1 & SQL Server 2022
Recently after a migration from SQL Server 2012 to SQL Server 2022, a end user contact me because SQL Server Management Studio (SSMS) does not work anymore when he want t o edit rows…
I was surprised and do a test…
The version of SSMS is 18.12.1 and it’s a version coming out the 21.06.2022…
It’s the last version before the version 19. More information about the ssms verions here
I install this version of SSMS and an instance SQL Server 2022 named inst01 with the database
AdventureWorks2022.
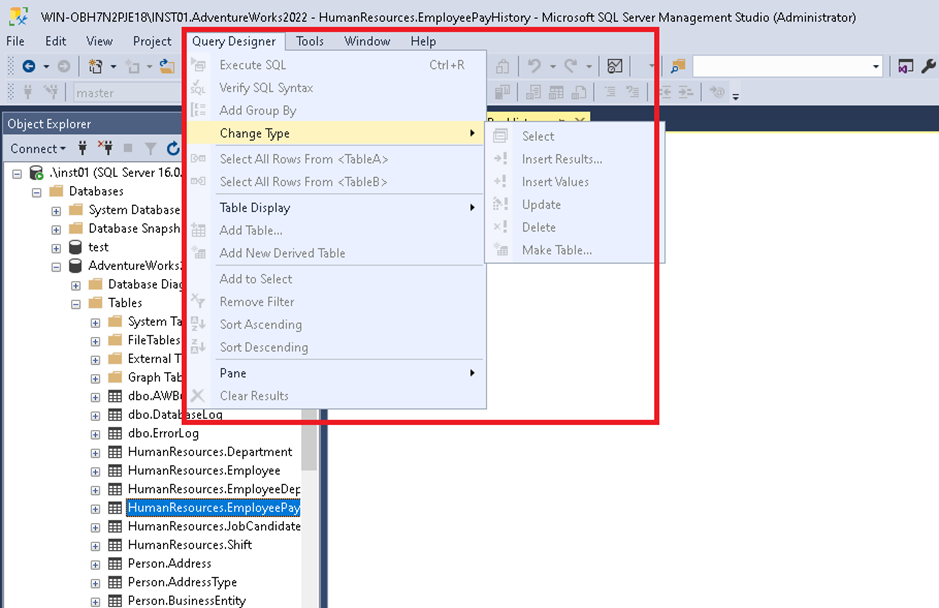
When I go on a table through the Object Explorer, and right click on “Edit top 200 rows”, I have am empty query window:
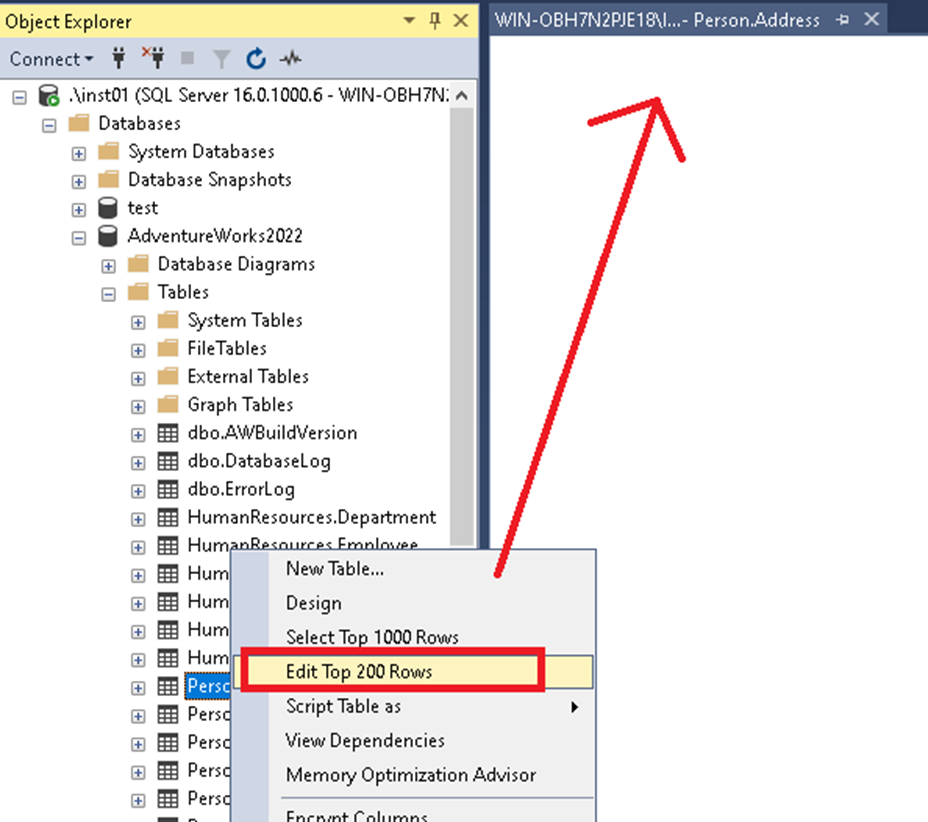
No error message and nothing can be done.
I searching in the Query designer to see if I can change something but all options are disable:
I also try to change the threshold to have all rows in Tools> Options:
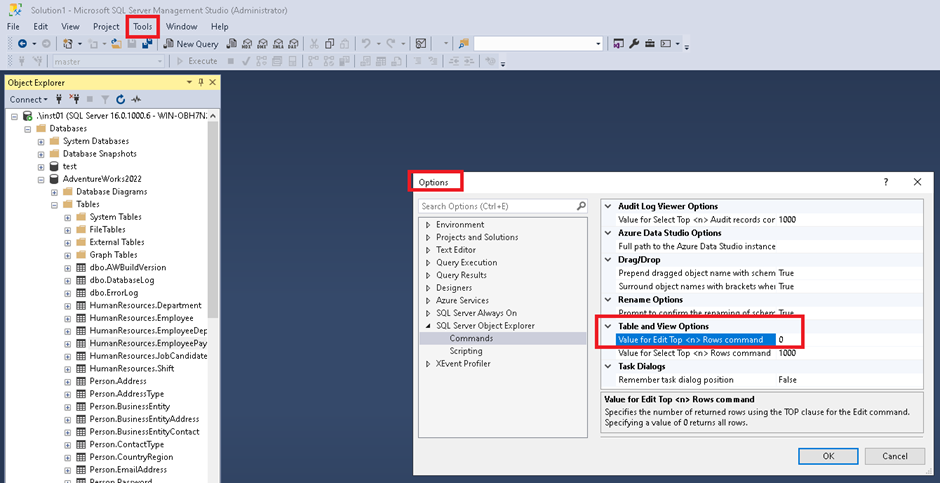
But the result is the same:
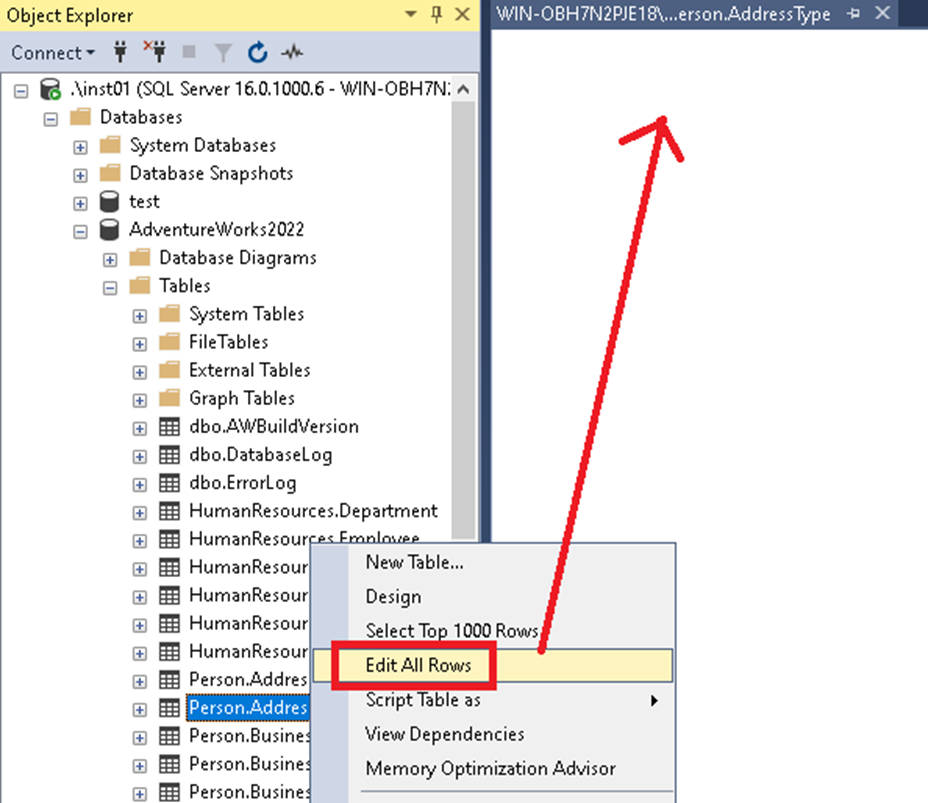
Conclusion: No workaround, nothing to do except update the SSMS version to a recent one (19 or more) to have again this option available for SQL Server 2022 instances.
Hope this can help you if you have the same issue and you don’t know why…
L’article “Edit Top 200 rows” does not work between SSMS 18.12.1 & SQL Server 2022 est apparu en premier sur dbi Blog.
Power BI – Scheduled refresh stuck
When creating reports, there are several modes through which we can import data. In our case, reports had been created using the “import mode.” In this mode, the data is imported or copied into our reports to be included. This then allows us to build (for example) dashboards.
Once the report is published, the data presented by the report is not automatically updated. Therefore, if data is added between the moment the report is published and the report is displayed, it will not be accessible or visible to the end users.
Here are some details:
- I create my report
- I connect to my datasource
- I choose the “import mode” to import my data
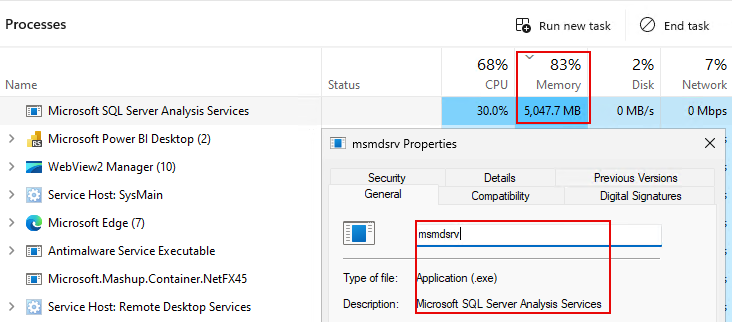
- From what we can see (via this mode), Power BI will call the Microsoft SQL Server Analysis Services to load the data into memory (Power BI launches an instance of SSAS through a separate process).
We can observe this:
- Start of data loading via SSAS
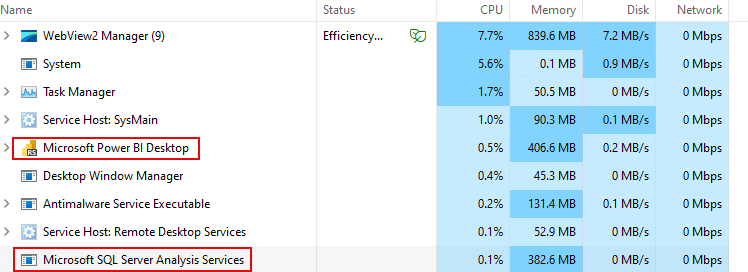
- Data is being loaded via SSAS
Changes are then made to how data is structured and organized (through xVelocity, VertiPaq).
Thus, it is necessary to load the entire dataset before being able to query it. The problem arises when the report has been published and the data is updated after publication. When the report is run, it does not reflect the changes made after its publication.
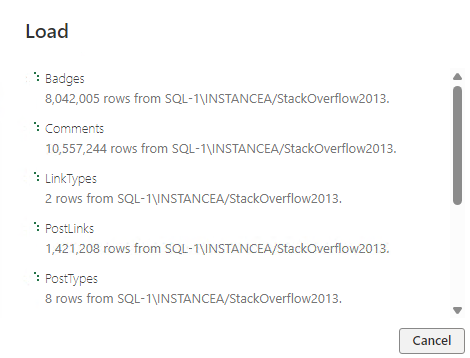
Here is an example:
- My report queries the LinkTypes table, which has 2 types of links: “Linked” and “Duplicate”
- Once published, I can see a table displaying this data
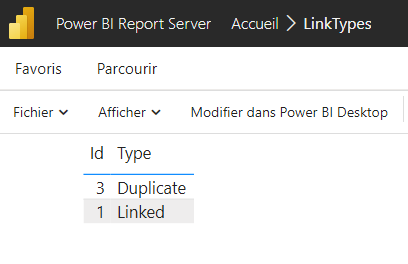
- I add a new row to the LinkTypes table
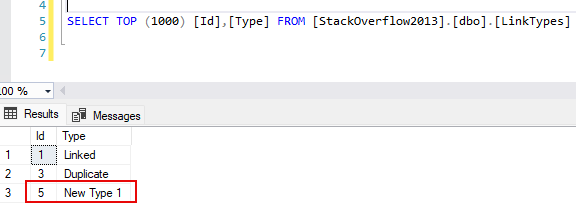
- A new run of the report does not display this data
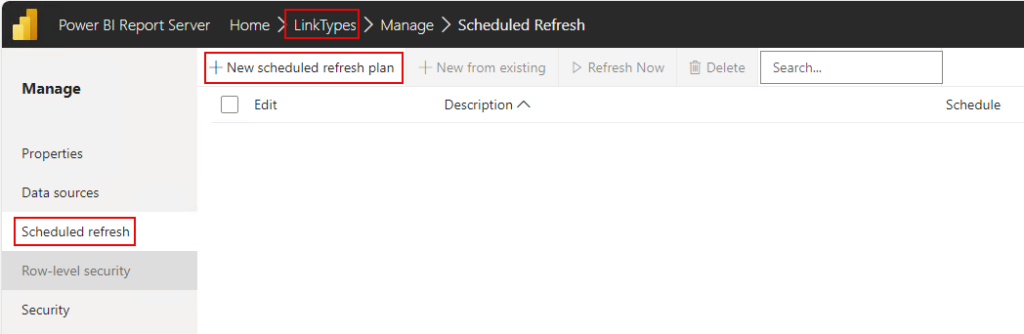
To address this issue, it is possible to create scheduled refreshes to update the data and ensure the report has up-to-date information.
 What is the problem?
In the case of our client, the scheduled refreshes were not occurring and remained stuck in the “in progress” or “refresh in progress” state. As a result, the reports did not have up-to-date data.
To understand the origin of the problem, we tried to analyze logs:
- We checked the Power BI logs. However, we found nothing. There were no errors (no timeouts, no exceptions, etc)
- The event viewer of the server hosting the Power BI service
- The SQL Server error log that hosts the Power BI databases
- SQL Server waits
- Extended events
- The jobs created by Power BI (which correspond to the scheduled refreshes) did not return any errors
To understand where the problem might be coming from, we need to analyze what happens when a scheduled refresh is requested.
When a scheduled refresh is requested, here are some of the operations that occur:
- The stored procedure “AddEvent” is called. This procedure inserts a row into the “Event” table:
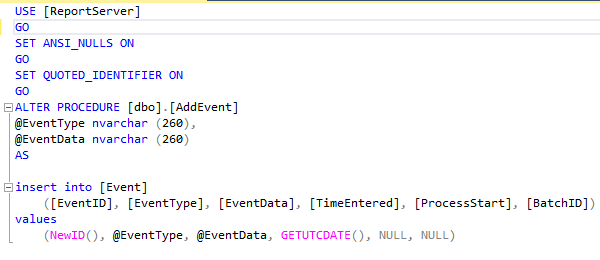
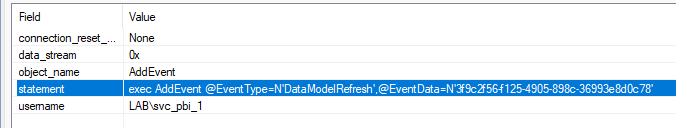
- A row is added to the “Event” table

- Power BI is notified that data needs to be updated
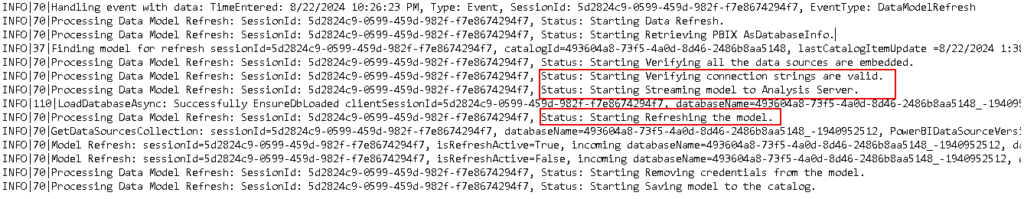
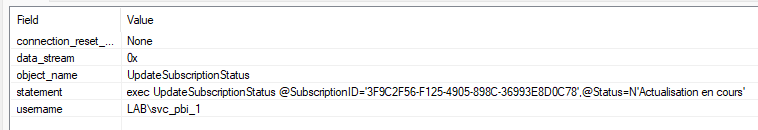
- The status of the subscription is updated (the value of the “@Status” is in Fench because I triggered a scheduled refresh through a web browser that uses French language)

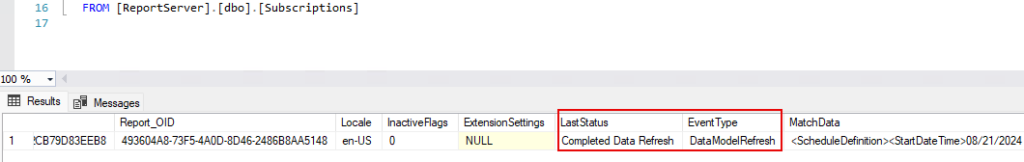
Other objects are then updated, such as the notifications table. The Event table is also updated to remove the corresponding event :
- The TakeEventFromQueue is a stored procedure that calls a delete operation
In our client’s case, the Events table contained data, but actions to execute a scheduled refresh were not adding any rows to the Event table. We decided to clear the contents of the Events table after backing up the database. After this action, the reports started updating correctly.
Thank you, Amine Haloui.
L’article Power BI – Scheduled refresh stuck est apparu en premier sur dbi Blog.
SQL Server: Basic AG – One listener, multiple databases
When it is not possible to have SQL Server Enterprise and there is a need to set up an AlwaysOn cluster, it is possible to use SQL Server Standard and implement basic availability groups.
However, the Standard edition of SQL Server comes with certain limitations when it comes to availability groups.
Here are some of these limitations
- Limited to 2 replicas
- No read-only access on the secondary replica
- No possibility to perform backups on the secondary
- 1 database per availability group
However some clients come with the following constraints
- Install an application that deploys and installs multiple databases
- Use SQL Server Standard
- Use only one listener, as the applications will only use one listener to connect to the primary replica
Requirements
- 1 database = 1 availability group = 0 or 1 listener
- We need to install multiple databases
- Our applications are configured to use only one listener (in their connection string), such as SharePoint, EasyVista, Business Central, M3…
- Therefore we will need to create multiple availability groups in order to benefit from high availability
Here are the questions that arise
If I need to install 10 databases for my application, this requires creating 10 availability groups and therefore 0 or several listeners.
- How can I ensure that all databases are in high availability with only one listener ?
- How can I have only one listener for our applications, multiple availability groups, and one database per availability group ?
- How can this limitation be overcome ?
Here is a summary of the solution
- We create our cluster
- We enable the AlwaysOn feature on all replicas
- We create our availability groups
- 1 availability group per database. Each of these availability groups will not contain any listener.
- 1 availability group containing a “monitoring” database and a listener
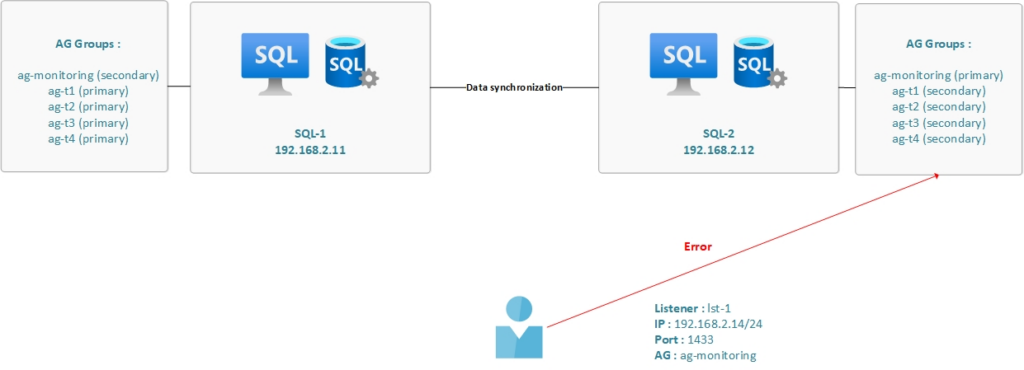
- When this availability group fails over, all other availability groups fail over as well. This is the “reference” database. All availability groups must share the same primary replica as the availability group that contains the “monitoring” database
Case 1
The availability groups share the same primary replica :
Case 2
The availability groups do not share the same primary replica :
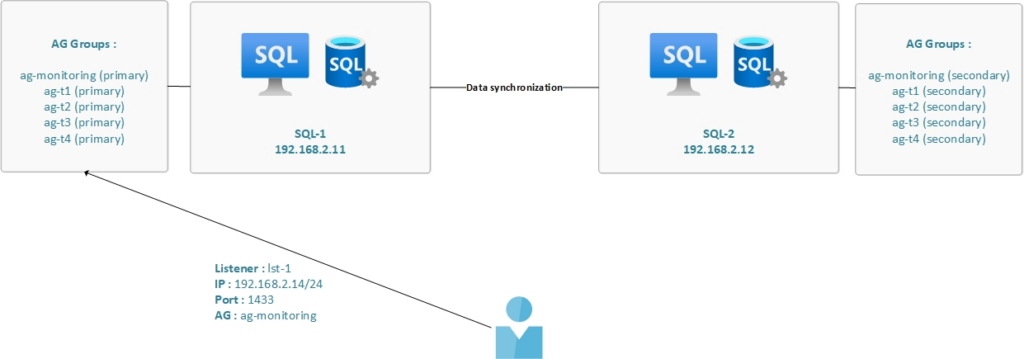
Here are some details about the environment
Virtual machines :
HostnameIPDomainFunctionOSad192.168.2.10lab.localDomain controlerWindows Server 2022sql-1192.168.2.11lab.localReplica 1Windows Server 2022sql-2192.168.2.12lab.localReplica 2Windows Server 2022Failover cluster details
- Failover cluster name : clu-1.lab.local
- IP : 192.168.2.13/24
SQL Server details
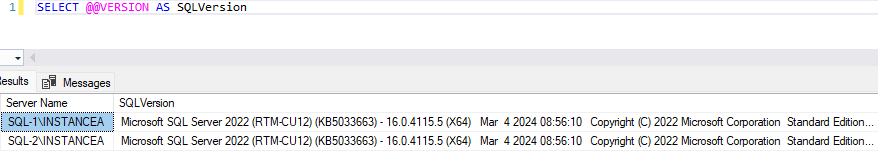
ReplicaIPSQL Server versionsql-1192.168.2.11/24SQL Server 2022 Standardsql-2192.168.2.12/24SQL Server 2022 StandardAlwaysOn details
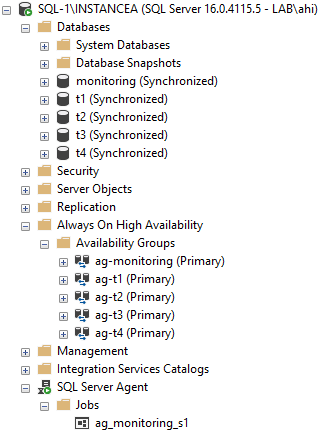
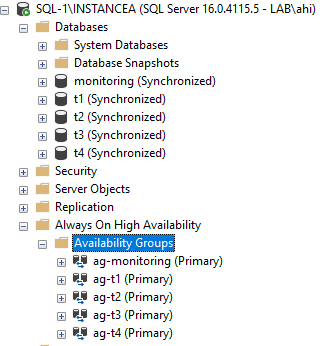
AG nameEndpoint portPortListenerIPag-monitoring50221433lst-1192.168.2.14/24ag-t15022N/AN/AN/Aag-t25022N/AN/AN/Aag-t35022N/AN/AN/Aag-t45022N/AN/AN/A Global architecture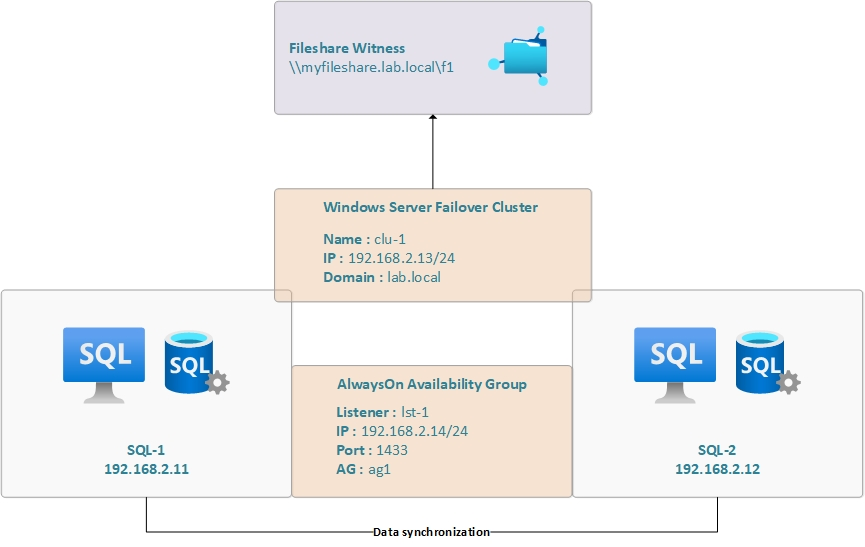
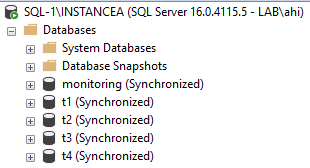
Our SQL Server instances
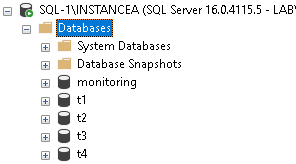
We integrate our databases to the availability groups and we check their states
SELECT
	dbs.name as dbs_name,
	dhdrs.synchronization_state_desc,
	ar.replica_server_name
	FROM sys.dm_hadr_database_replica_states AS dhdrs
		INNER JOIN sys.availability_replicas AS ar
			ON dhdrs.replica_id = ar.replica_id
		INNER JOIN sys.databases AS dbs
			ON dhdrs.database_id = dbs.database_id
ORDER BY ar.replica_server_name ASC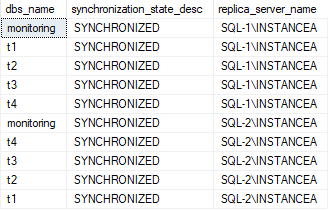
We check the availability groups configuration
SELECT
ar.replica_server_name,
ar.availability_mode_desc,
ag.[name] AS dbs_name,
dhars.role_desc,
CASE
WHEN ag.basic_features = 1 THEN 'Basic AG'
ELSE 'Not Basic AG'
END AS ag_type
FROM sys.availability_replicas AS ar
INNER JOIN sys.availability_groups AS ag
ON ar.group_id = ag.group_id
INNER JOIN sys.dm_hadr_availability_replica_states AS dhars
ON ar.replica_id = dhars.replica_id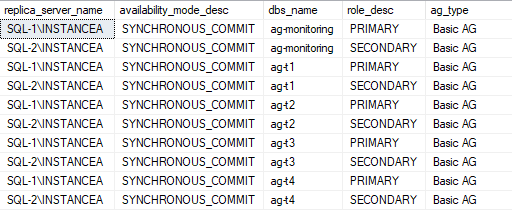 Solutions
We present two solutions to ensure that the availability groups share the same primary replica:
- Solution 1: a job that runs every 5 minutes and checks if the availability groups share the same replica. If they do not, a failover is performed. The “reference” availability group in our case is the group named “ag-monitoring” The other availability groups must share the same primary replica.
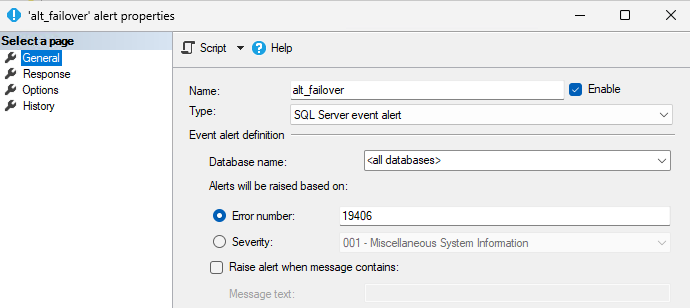
- Solution 2: an alert and a job that perform the following tasks:
- The alert is triggered when a failover is detected. The alert then calls a job.
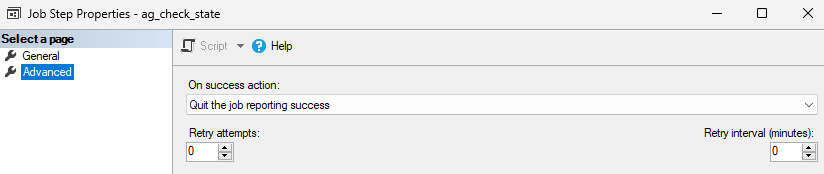
- This job is divided into 3 steps:
- Save the failover date
- Wait for a certain duration before checking the state of the availability groups (the failover may take some time)
- Check the configuration of the availability groups (what their primary replica is)
- If the availability groups ag-t1, ag-t2, ag-t3, and ag-t4 do not share the same primary replica, a failover is performed
- This job is divided into 3 steps:
- The alert is triggered when a failover is detected. The alert then calls a job.
Solution 1
The job is deployed on both replicas. We check if the database is open for read/write before performing any operations.
Job configuration :
Code
IF ((SELECT DATABASEPROPERTYEX('monitoring', 'Updateability')) = 'READ_WRITE')
BEGIN
DECLARE @replica_server NVARCHAR(100),
		@ag_name NVARCHAR(100),
		@failover_command NVARCHAR(100)

DECLARE cursor_failover_commands CURSOR FOR
   WITH T_AG_Monitoring (replica_server, ag_name, role_name)
AS
(
SELECT
	ar.replica_server_name,
	ag.[name] as ag_name,
	dhars.role_desc

	FROM sys.availability_replicas AS ar
		INNER JOIN sys.availability_groups AS ag
			ON ar.group_id = ag.group_id
		LEFT JOIN sys.dm_hadr_availability_replica_states as dhars
			ON ar.replica_id = dhars.replica_id

	WHERE ag.[name] = 'ag-monitoring'
),
T_AG_Databases (replica_server, ag_name, role_name)
AS
(
	SELECT
	ar.replica_server_name,
	ag.[name] as ag_name,
	dhars.role_desc

	FROM sys.availability_replicas AS ar
		INNER JOIN sys.availability_groups AS ag
			ON ar.group_id = ag.group_id
		LEFT JOIN sys.dm_hadr_availability_replica_states as dhars
			ON ar.replica_id = dhars.replica_id

	WHERE ag.[name] <> 'ag-monitoring'
) SELECT
	T_AG_Databases.replica_server,
	T_AG_Databases.ag_name,
	CASE
		WHEN T_AG_Databases.role_name IS NULL THEN 'ALTER AVAILABILITY GROUP [' + T_AG_Databases.ag_name + '] FAILOVER;'
	END AS failover_command
	FROM T_AG_Monitoring
		RIGHT JOIN T_AG_Databases
			ON T_AG_Monitoring.replica_server = T_AG_Databases.replica_server
			AND T_AG_Monitoring.role_name = T_AG_Databases.role_name

OPEN cursor_failover_commands
FETCH cursor_failover_commands INTO @replica_server, @ag_name, @failover_command

WHILE @@FETCH_STATUS = 0
BEGIN
	IF (LEN(@failover_command) >= 1)
	BEGIN
		EXEC(@failover_command);
	END
    FETCH cursor_failover_commands INTO @replica_server, @ag_name, @failover_command
END

CLOSE cursor_failover_commands
DEALLOCATE cursor_failover_commands
END
Solution 2
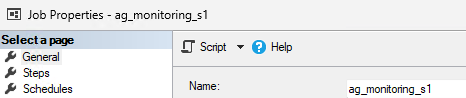
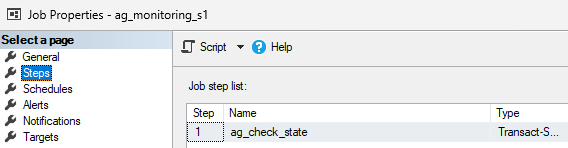
The alert and the job are present on both replicas.
Alert configuration:
Job configuration:
Code :
USE
GO

BEGIN TRANSACTION
DECLARE @ReturnCode INT
SELECT @ReturnCode = 0

IF NOT EXISTS (SELECT name FROM msdb.dbo.syscategories WHERE name=N'[Uncategorized (Local)]' AND category_class=1)

BEGIN
EXEC @ReturnCode = msdb.dbo.sp_add_category @class=N'JOB', @type=N'LOCAL', @name=N'[Uncategorized (Local)]'

IF (@@ERROR <> 0 OR @ReturnCode <> 0) GOTO QuitWithRollback
END

DECLARE @jobId BINARY(16)

EXEC @ReturnCode =  msdb.dbo.sp_add_job @job_name=N'ag_monitoring_s2',

@enabled=0,

@notify_level_eventlog=0,
@notify_level_email=0,
@notify_level_netsend=0,
@notify_level_page=0,
@delete_level=0,
@description=N'No description available.',
@category_name=N'[Uncategorized (Local)]',

@owner_login_name=N'sa', @job_id = @jobId OUTPUT

IF (@@ERROR <> 0 OR @ReturnCode <> 0) GOTO QuitWithRollback

EXEC @ReturnCode = msdb.dbo.sp_add_jobstep @job_id=@jobId, @step_name=N'ag_monitoring',
@step_id=1,
@cmdexec_success_code=0,
@on_success_action=3,
@on_success_step_id=0,
@on_fail_action=2,
@on_fail_step_id=0,
@retry_attempts=1,
@retry_interval=1,
@os_run_priority=0, @subsystem=N'TSQL',

@command=N'IF ((SELECT DATABASEPROPERTYEX(''monitoring'', ''Updateability'')) = ''READ_WRITE'')

BEGIN

MERGE monitoring.dbo.t_tracefailover_tfr AS t_target
USING (
SELECT
id,
last_occurrence_date,
last_occurrence_time
FROM msdb.dbo.sysalerts

) AS t_source

ON t_source.id = t_target.tfr_id

WHEN NOT MATCHED THEN

INSERT (tfr_id, tfr_last_occurence_date, tfr_last_occurence_time) VALUES (t_source.id, t_source.last_occurrence_date, t_source.last_occurrence_time)

WHEN MATCHED THEN

UPDATE SET t_target.tfr_last_occurence_date = t_source.last_occurrence_date, t_target.tfr_last_occurence_time = t_source.last_occurrence_time;

END
ELSE

BEGIN
PRINT ''Secondary replica'';
END',

@database_name=N'master',

@flags=0

IF (@@ERROR <> 0 OR @ReturnCode <> 0) GOTO QuitWithRollback

EXEC @ReturnCode = msdb.dbo.sp_add_jobstep @job_id=@jobId, @step_name=N'ag_wait_before_check',

@step_id=2,

@cmdexec_success_code=0,
@on_success_action=3,
@on_success_step_id=0,
@on_fail_action=2,
@on_fail_step_id=0,
@retry_attempts=0,
@retry_interval=0,
@os_run_priority=0, @subsystem=N'TSQL',

@command=N'BEGIN
    WAITFOR DELAY ''00:01'';
END;',

@database_name=N'master',
@flags=0

IF (@@ERROR <> 0 OR @ReturnCode <> 0) GOTO QuitWithRollback

EXEC @ReturnCode = msdb.dbo.sp_add_jobstep @job_id=@jobId, @step_name=N'ag_check_state',

@step_id=3,
@cmdexec_success_code=0,
@on_success_action=1,
@on_success_step_id=0,
@on_fail_action=2,
@on_fail_step_id=0,
@retry_attempts=0,
@retry_interval=0,
@os_run_priority=0, @subsystem=N'TSQL',

@command=N'IF ((SELECT DATABASEPROPERTYEX(''monitoring'', ''Updateability'')) = ''READ_WRITE'')

BEGIN

DECLARE @replica_server NVARCHAR(100),
@ag_name NVARCHAR(100),
@failover_command NVARCHAR(100)

DECLARE cursor_failover_commands CURSOR FOR
   WITH T_AG_Monitoring (replica_server, ag_name, role_name)
AS

(
SELECT
ar.replica_server_name,
ag.[name] as ag_name,
dhars.role_desc
FROM sys.availability_replicas AS ar
INNER JOIN sys.availability_groups AS ag
ON ar.group_id = ag.group_id
LEFT JOIN sys.dm_hadr_availability_replica_states as dhars
ON ar.replica_id = dhars.replica_id
WHERE ag.[name] = ''ag-monitoring''
),

T_AG_Databases (replica_server, ag_name, role_name)

AS
(

SELECT
ar.replica_server_name,
ag.[name] as ag_name,
dhars.role_desc
FROM sys.availability_replicas AS ar
INNER JOIN sys.availability_groups AS ag
ON ar.group_id = ag.group_id
LEFT JOIN sys.dm_hadr_availability_replica_states as dhars
ON ar.replica_id = dhars.replica_id
WHERE ag.[name] <> ''ag-monitoring''

) SELECT
T_AG_Databases.replica_server,
T_AG_Databases.ag_name,
CASE
WHEN T_AG_Databases.role_name IS NULL THEN ''ALTER AVAILABILITY GROUP ['' + T_AG_Databases.ag_name + ''] FAILOVER;''
END AS failover_command

FROM T_AG_Monitoring

RIGHT JOIN T_AG_Databases
ON T_AG_Monitoring.replica_server = T_AG_Databases.replica_server
AND T_AG_Monitoring.role_name = T_AG_Databases.role_name

OPEN cursor_failover_commands
FETCH cursor_failover_commands INTO @replica_server, @ag_name, @failover_command
WHILE @@FETCH_STATUS = 0

BEGIN

IF (LEN(@failover_command) >= 1)

BEGIN
PRINT ''Failover'';
EXEC(@failover_command);

END
    FETCH cursor_failover_commands INTO @replica_server, @ag_name, @failover_command
END

CLOSE cursor_failover_commands
DEALLOCATE cursor_failover_commands
END',

@database_name=N'master',

@flags=0

IF (@@ERROR <> 0 OR @ReturnCode <> 0) GOTO QuitWithRollback

EXEC @ReturnCode = msdb.dbo.sp_update_job @job_id = @jobId, @start_step_id = 1

IF (@@ERROR <> 0 OR @ReturnCode <> 0) GOTO QuitWithRollback

EXEC @ReturnCode = msdb.dbo.sp_add_jobserver @job_id = @jobId, @server_name = N'(local)'

IF (@@ERROR <> 0 OR @ReturnCode <> 0) GOTO QuitWithRollback

COMMIT TRANSACTION

GOTO EndSave

QuitWithRollback:

    IF (@@TRANCOUNT > 0) ROLLBACK TRANSACTION

EndSave:

GO
First solution test :
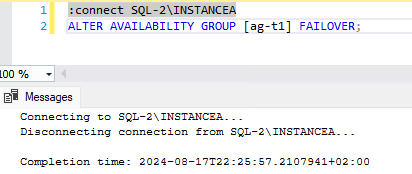
Initial configuration : the availability groups share the same primary replica.
We perform a failover of the availability group ag-t1.
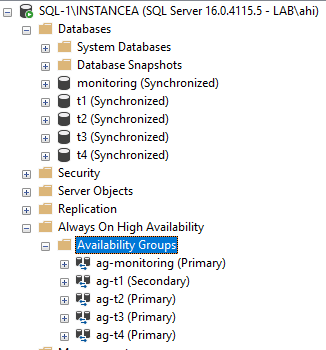
We check the configuration:
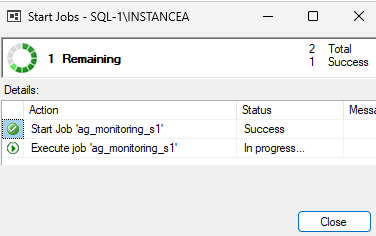
The job is executing:
We check the configuration:
 Conclusion
- Solution 1 has 2 drawbacks:
- The job could potentially be triggered during a failover
- The job runs every 5 minutes. Therefore, in the worst case, there could be a 5-minute delay in aligning the availability groups
- Solution 2 is more complex and has the following drawbacks:
- The current backup history is a copy of the dbo.sysalerts table. As a result, the data in this table does not use the GETDATE() function. We could add a column to store the date of the last failover
- The job can be executed multiple times because it is triggered by an alert (alt_failover)
It is also important to verify data synchronization before performing a failover.
Thank you, Amine Haloui.
L’article SQL Server: Basic AG – One listener, multiple databases est apparu en premier sur dbi Blog.
CloudNativePG – Connecting external applications
Now that we know how we can benchmark a CloudNativePG deployment, it is time to look at how we can connect external applications to the PostgreSQL cluster. Usually, applications run in the same Kubernetes cluster and can directly talk to our PostgreSQL deployment, but sometimes it is required to also connect with external applications or services. By default, this does not work, as nothing is exposed externally.
You can easily check this by looking at the services we currently have:
k8s@k8s1:~$ kubectl get services -n default
NAME               TYPE        CLUSTER-IP       EXTERNAL-IP   PORT(S)    AGE
kubernetes         ClusterIP   10.96.0.1        <none>        443/TCP    32d
my-pg-cluster-r    ClusterIP   10.107.190.52    <none>        5432/TCP   8d
my-pg-cluster-ro   ClusterIP   10.109.169.21    <none>        5432/TCP   8d
my-pg-cluster-rw   ClusterIP   10.103.171.191   <none>        5432/TCP   8d
There are IP addresses and services for all pods in the cluster, but those addresses are only available inside the cluster. For the external IP addresses there is “<none>” for all of them.
Before we make those services available externally, lets quickly check what they mean:
- my-pg-cluster-r: Connects to any of the nodes for read only operations
- my-pg-cluster-ro: Connects always to a read only replica (hot standby)
- my-pg-cluster-rw: Connects always to the primary node
Whatever connects to the cluster, should us one of those services and never connect to a PostreSQL instance directly. The reason is, that those services are managed by the operator and you should rely on the internal Kubernetes DNS for connecting to the cluster services.
What we need to expose the PostgreSQL cluster services is an Ingress, and an Ingress Controller on top of that in combination with a load balancer.
One of the quite popular Ingress Controllers is the Ingress-Nginx Controller, and this is the one we’re going to use here as well. Getting this installed, can again easily be done by using Helm, in pretty much the same way as we did it with OpenEBS in the storage post, but before we’re going to deploy the METALLB load balancer:
k8s@k8s1:~$ helm install metallb metallb/metallb --namespace metallb-system --create-namespace
NAME: metallb
LAST DEPLOYED: Fri Aug  9 09:43:03 2024
NAMESPACE: metallb-system
STATUS: deployed
REVISION: 1
TEST SUITE: None
NOTES:
MetalLB is now running in the cluster.

Now you can configure it via its CRs. Please refer to the metallb official docs
on how to use the CRs.
This creates a new namespace called “metalllb-system” and a few pods:
k8s@k8s1:~$ kubectl get pods -A | grep metal
metallb-system         metallb-controller-77cb7f5d88-hxndw                     1/1     Running                0               26s
metallb-system         metallb-speaker-5phx6                                   4/4     Running                0               26s
metallb-system         metallb-speaker-bjdxj                                   4/4     Running                0               26s
metallb-system         metallb-speaker-c54z6                                   4/4     Running                0               26s
metallb-system         metallb-speaker-xzphl                                   4/4     Running                0               26s
The next step is to create the Ingress-Nginx Controller:
k8s@k8s1:~$ helm upgrade --install ingress-nginx ingress-nginx --repo https://kubernetes.github.io/ingress-nginx --namespace ingress-nginx --create-namespace
Release "ingress-nginx" does not exist. Installing it now.
NAME: ingress-nginx
LAST DEPLOYED: Fri Aug  9 09:49:43 2024
NAMESPACE: ingress-nginx
STATUS: deployed
REVISION: 1
TEST SUITE: None
NOTES:
The ingress-nginx controller has been installed.
It may take a few minutes for the load balancer IP to be available.
You can watch the status by running 'kubectl get service --namespace ingress-nginx ingress-nginx-controller --output wide --watch'

An example Ingress that makes use of the controller:
  apiVersion: networking.k8s.io/v1
  kind: Ingress
  metadata:
    name: example
    namespace: foo
  spec:
    ingressClassName: nginx
    rules:
      - host: www.example.com
        http:
          paths:
            - pathType: Prefix
              backend:
                service:
                  name: exampleService
                  port:
                    number: 80
              path: /
    # This section is only required if TLS is to be enabled for the Ingress
    tls:
      - hosts:
        - www.example.com
        secretName: example-tls

If TLS is enabled for the Ingress, a Secret containing the certificate and key must also be provided:

  apiVersion: v1
  kind: Secret
  metadata:
    name: example-tls
    namespace: foo
  data:
    tls.crt: <base64 encoded cert>
    tls.key: <base64 encoded key>
  type: kubernetes.io/tls
Same story here, we get a new namespace:
k8s@k8s1:~$ kubectl get pods -n ingress-nginx
NAME                                        READY   STATUS    RESTARTS   AGE
ingress-nginx-controller-69bd47995d-krt7h   1/1     Running   0          2m33s
At this stage, you’ll notice that we still do not have any services exposed externally ( we still see “<pending>” for the EXTERNAL-IP):
k8s@k8s1:~$ kubectl get svc -A | grep nginx
ingress-nginx          ingress-nginx-controller               LoadBalancer   10.109.240.37    <pending>     80:31719/TCP,443:32412/TCP                              103s
ingress-nginx          ingress-nginx-controller-admission     ClusterIP      10.103.255.169   <none>        443/TCP                                                 103s
This is not a big surprise, as we did not tell the load balancer which IP addresses to request/assign. This is done easily:
k8s@k8s1:~$ cat lb.yaml
---
apiVersion: metallb.io/v1beta1
kind: IPAddressPool
metadata:
  name: default
  namespace: metallb-system
spec:
  addresses:
  - 192.168.122.210-192.168.122.215
  autoAssign: true
---
apiVersion: metallb.io/v1beta1
kind: L2Advertisement
metadata:
  name: default
  namespace: metallb-system
spec:
  ipAddressPools:
  - default
k8s@k8s1:~$ kubectl apply -f lb.yaml
ipaddresspool.metallb.io/default created
l2advertisement.metallb.io/default created
k8s@k8s1:~$ kubectl get services -n ingress-nginx
NAME                                 TYPE           CLUSTER-IP       EXTERNAL-IP       PORT(S)                      AGE
ingress-nginx-controller             LoadBalancer   10.109.240.37    192.168.122.210   80:31719/TCP,443:32412/TCP   3m32s
ingress-nginx-controller-admission   ClusterIP      10.103.255.169   <none>            443/TCP                      3m32s
From now on the LoadBalancer got an IP address automatically assigned from the pool of addresses we’ve assigned. The next steps are covered in the CloudNativePG documentation: First we need a config map for the service we want to expose:
k8s@k8s1:~$ cat tcp-services-configmap.yaml
apiVersion: v1
kind: ConfigMap
metadata:
  name: tcp-services
  namespace: ingress-nginx
data:
  5432: default/my-pg-cluster-rw:5432

k8s@k8s1:~$ kubectl apply -f tcp-services-configmap.yaml
configmap/tcp-services created
k8s@k8s1:~$ kubectl get cm -n ingress-nginx
NAME                       DATA   AGE
ingress-nginx-controller   1      6m4s
kube-root-ca.crt           1      6m8s
tcp-services               1      12s
Now we need to modify the ingress-nginx service to include the new port:
k8s@k8s1:~$ kubectl get svc ingress-nginx-controller -n ingress-nginx -o yaml > service.yaml
k8s@k8s1:~$ vi service.yaml
...
  ports:
  - appProtocol: http
    name: http
    nodePort: 31719
    port: 80
    protocol: TCP
    targetPort: http
  - appProtocol: https
    name: https
    nodePort: 32412
    port: 443
    protocol: TCP
    targetPort: https
  - appProtocol: tcp
    name: postgres
    port: 5432
    targetPort: 5432
...
k8s@k8s1:~$ kubectl apply -f service.yaml
Warning: resource services/ingress-nginx-controller is missing the kubectl.kubernetes.io/last-applied-configuration annotation which is required by kubectl apply. kubectl apply should only be used on resources created declaratively by either kubectl create --save-config or kubectl apply. The missing annotation will be patched automatically.
service/ingress-nginx-controller configured
The last step is to link our config map into the “ingress-nginx-controller” deployment:
k8s@k8s1:~$ kubectl edit deploy ingress-nginx-controller -n ingress-nginx
...
    spec:
      containers:
      - args:
        - /nginx-ingress-controller
        - --publish-service=$(POD_NAMESPACE)/ingress-nginx-controller
        - --election-id=ingress-nginx-leader
        - --controller-class=k8s.io/ingress-nginx
        - --ingress-class=nginx
        - --configmap=$(POD_NAMESPACE)/ingress-nginx-controller
        - --tcp-services-configmap=ingress-nginx/tcp-services
        - --validating-webhook=:8443
        - --validating-webhook-certificate=/usr/local/certificates/cert
        - --validating-webhook-key=/usr/local/certificates/key
        - --enable-metrics=false
...
From now on the PostgreSQL cluster can be reached from outside the Kubernetes cluster:
k8s@k8s1:~$ kubectl get svc -n ingress-nginx
NAME                                 TYPE           CLUSTER-IP       EXTERNAL-IP       PORT(S)                                     AGE
ingress-nginx-controller             LoadBalancer   10.109.240.37    192.168.122.210   80:31719/TCP,443:32412/TCP,5432:32043/TCP   6d23h
ingress-nginx-controller-admission   ClusterIP      10.103.255.169   <none>            443/TCP                                     6d23h
k8s@k8s1:~$ psql -h 192.168.122.210
Password for user k8s:
psql: error: connection to server at "192.168.122.210", port 5432 failed: FATAL:  password authentication failed for user "k8s"
connection to server at "192.168.122.210", port 5432 failed: FATAL:  password authentication failed for user "k8s"
L’article CloudNativePG – Connecting external applications est apparu en premier sur dbi Blog.
Setting up MariaDB Galera Cluster
In this blog I will show you how you can setup a basic MariaDB Galera Cluster on Debian 11 (bullseye).
If you wish to have a more general overview first you can have a look here: https://mariadb.com/kb/en/what-is-mariadb-galera-cluster/
For this we have 3 servers: galera-cluster-1a/b/c. The following steps will first be executed on my first node, galera-cluster-1a still these steps have to executed on the other nodes as well to build the whole cluster.
First the servers will be prepared for the installation. This includes different packages to be installed and ports to be opened.
galera-cluster-1a:~$ sudo apt update
galera-cluster-1a:~$ sudo apt-get install ufw
galera-cluster-1a:~$ sudo ufw enable
galera-cluster-1a:~$ sudo ufw allow 3306
galera-cluster-1a:~$ sudo ufw allow 4444
galera-cluster-1a:~$ sudo ufw allow 4567
galera-cluster-1a:~$ sudo ufw allow 4568
galera-cluster-1a:~$ sudo ufw allow 22
Installing MariaDB 11.3.2 and other packages
galera-cluster-1a:~$ sudo apt-get install libsnmp-perl -y
galera-cluster-1a:~$ sudo curl -LsS -O https://downloads.mariadb.com/MariaDB/mariadb_repo_setup
galera-cluster-1a:~$ sudo bash mariadb_repo_setup --os-type=debian --os-version=bullseye --mariadb-server-version=11.3.2
galera-cluster-1a:~$ sudo wget http://ftp.us.debian.org/debian/pool/main/r/readline5/libreadline5_5.2+dfsg-3+b13_amd64.deb
galera-cluster-1a:~$ sudo dpkg -i libreadline5_5.2+dfsg-3+b13_amd64.deb
galera-cluster-1a:~$ sudo apt-get update
galera-cluster-1a:~$ sudo apt-get install mariadb-server mariadb-client -y
galera-cluster-1a:~$ sudo systemctl enable mariadb
sudo apt-get install percona-toolkit -y
Now you can login to MariaDB and check the version
galera-cluster-1a:~$ mariadb
Welcome to the MariaDB monitor.  Commands end with ; or \g.
Your MariaDB connection id is 32
Server version: 11.3.2-MariaDB-1:11.3.2+maria~deb11 mariadb.org binary distribution
Copyright (c) 2000, 2018, Oracle, MariaDB Corporation Ab and others.
Type 'help;' or '\h' for help. Type '\c' to clear the current input statement.
For the final touch for the basic installation of MariaDB we are going to secure it. Answering yes to all the changes it proposes.
galera-cluster-1a:~$ sudo mariadb-secure-installation
We recommend creating a dedicated backup user for mariabackup like this:
galera-cluster-1a:~$ mariadb
MariaDB [(none)]> create user 'mariabackup'@'%' identified by 'XXX';
Query OK, 0 rows affected (0.001 sec)
MariaDB [(none)]> GRANT RELOAD, PROCESS, LOCK TABLES, REPLICATION CLIENT ON *.* TO 'mariabackup'@'%';
Query OK, 0 rows affected (0.001 sec)
MariaDB [(none)]> create user 'mariabackup'@'localhost' identified by 'XXX';
Query OK, 0 rows affected (0.001 sec)
MariaDB [(none)]> GRANT RELOAD, PROCESS, LOCK TABLES, REPLICATION CLIENT ON *.* TO 'mariabackup'@'localhost';
Query OK, 0 rows affected (0.001 sec)
MariaDB [(none)]> flush privileges;
MariaDB [(none)]> exit
Creating a dedicated directory for logs.
sudo mkdir /var/log/mariadb
sudo chown mysql:mysql /var/log/mariadb
In the /etc/mysql/mariadb.conf.d/50-server.cnf file we add the following options at the end to the [mariadb-11.3] section.
# This group is only read by MariaDB-11.3 servers.
# If you use the same .cnf file for MariaDB of different versions,
# use this group for options that older servers don't understand
[mariadb-11.3]
log_warnings=2
log_error=/var/log/mysql/mariadb.err
general_log = 1
general_log_file = /var/log/mysql/mariadb.log

[mysqldump]
user=dump
password=XXX
max_allowed_packet = 512M

[mariabackup]
user=mariabackup
password=XXX
databases-exclude=lost+found
If you want to use mariabackup for backups and replication you will have to create the user and add the last section [mariabackup]
Step 3: Configuring Galera ClusterChange the galera config file to the following. It is also possible to use the IPs instead of hostnames.
galera-cluster-1a:~$ cat /etc/mysql/mariadb.conf.d/60-galera.cnf
[galera]
# Mandatory settings
wsrep_on = ON
wsrep_cluster_name = MariaDB Galera Cluster
wsrep_cluster_address = gcomm://galera-cluster-1a,galera-cluster-1b,galera-cluster-1c
wsrep_provider = /usr/lib/galera/libgalera_smm.so
binlog_format = row
default_storage_engine = InnoDB
innodb_autoinc_lock_mode = 2
# Allow server to accept connections on all interfaces.
bind-address = 0.0.0.0

# Optional settings
wsrep_slave_threads = 1
innodb_flush_log_at_trx_commit = 0
wsrep_sst_auth = mariabackup:manager
wsrep_sst_method=mariabackup
wsrep_node_address=galera-cluster-1a
wsrep_sst_receive_address= galera-cluster-1a
Now everything is ready and we can start the MariaDB Server in cluster mode.
galera-cluster-1a:~$  sudo systemctl stop mariadb.service
galera-cluster-1a:~$  sudo galera_new_cluster
Lets check if the one node cluster has successfully started. The start position on the very first start should look like the following
galera-cluster-1a:~$ ps -f -u mysql
UID        PID  PPID  C STIME TTY          TIME CMD
mysql     2081     1  0 14:37 ?        00:00:00 /usr/sbin/mariadbd --wsrep-new-cluster --wsrep_start_position= 00000000-0000-0000-0000-000000000000:-1
Login to your instance and check the cluster size
galera-cluster-1a:~$ mariadb

MariaDB [(none)]> show global status like 'wsrep_cluster_size';
+--------------------+-------+
| Variable_name      | Value |
+--------------------+-------+
| wsrep_cluster_size | 1     |
+--------------------+-------+
MariaDB [(none)]> quit
Repeat steps 1-3 on the other two nodes but you do not have to bootstrap these nodes.
Simply restart the mariadb.service at the end for them to sync with the cluster.
galera-cluster-1b:~$ sudo systemctl restart mariadb.service
galera-cluster-1c:~$ sudo systemctl restart mariadb.service
Afterwards you can check the cluster size again.
galera-cluster-1a:~$ mariadb
MariaDB [(none)]> show global status like 'wsrep_cluster_size';
+--------------------+-------+
| Variable_name      | Value |
+--------------------+-------+
| wsrep_cluster_size | 3     |
+--------------------+-------+
Check out this blog about using mariabackup to repair your replication: https://www.dbi-services.com/blog/mariadb-repair-replication-through-db-restore-mariabackup/
L’article Setting up MariaDB Galera Cluster est apparu en premier sur dbi Blog.
Alfresco – Impact of SSL and LB on the import perf.
Have you ever wondered what is the impact of SSL communications or the impact of a specific Load Balancing mechanisms on the performance of your Alfresco environment? Alfresco (the Company at that time, before it became Hyland) ran some benchmark and published the results a few years ago but that might not be very relevant to you as you might be running your infrastructure very differently to what they used. Networking & latency, CPUs, memory, disks, virtualization, etc… All that will have an impact on the performance so you cannot really take external data for granted. In this blog, I will look specifically on the import side of things.
I. Setup detailsRecently, I had a customer which wanted to migrate 3 million documents to Alfresco and they wanted to know how long it could take. This specific environment has 2 Alfresco Content Services (7.x) Nodes in Cluster as well as 2 Alfresco Search Services (Solr6) Nodes using Sharding. It’s not a new environment, it has been running since several years already and has around 10TB of content stored inside. At dbi services, we have a team that can help customers execute Load Tests / Stress Tests for their applications (e.g. this blog). However, that will usually require a certain amount of time to integrate the Load Test software (like JMeter) and the target application as well as to design the needed scenarios beforehand. This customer didn’t really need to pull out the big gun as it was just to get an idea on the import speed. Instead, I proposed to simply script a small importer to be as close as possible to the exact performance that the migration would have, using the REST-API from outside of the Alfresco Cluster Nodes (to consider also the networking & latency), using the same user/permissions/ACLs, etc.
To give a bit more details regarding the setup, there is an Apache HTTPD installed on each Alfresco Nodes. The customer doesn’t have any global load balancer solution (neither hardware nor software) and therefore, to avoid single point of failure (SPOF), the DNS would redirect the traffic to any of the 2 Apache HTTPD, which would then again redirect the traffic to any of the 2 Apache Tomcat hosting the alfresco.war application. That’s one way to do it but there are other solutions possible. Therefore, the question came about what the impact of the SSL communications was exactly as well as what would be the difference if the Load Balancing mechanisms would be different. Like, for example, only redirecting the requests to the local Tomcat and not caring about the second Node. If you do that, of course you might introduce a SPOF, but for the migration purpose, which is very short-lived and that can use a decided URL/PORT, it could be an option (assuming it brings a non-negligeable performance gain).
II. Test casesOn a TEST environment, I decided to slightly update the Apache HTTPD and Apache Tomcat configurations to allow for these test cases:
- Apache HTTPD in HTTPS with Load Balancing (mod_jk) >> standard day-to-day configuration used so far, to avoid SPOF
- Apache HTTPD in HTTP with Load Balancing (mod_jk) >> normally redirect the traffic to HTTPS (above config) but I modified that to send the request to Tomcat instead
- Apache Tomcat in HTTP (bypass Apache HTTPD) >> normally blocked but I allowed it
- Apache HTTPD in HTTPS without Load Balancing (proxy) >> normally doesn’t exist but I added a simple proxy config to send the request to Tomcat instead
- Apache HTTPD in HTTP without Load Balancing (proxy) >> normally doesn’t exist but I added a simple proxy config to send the request to Tomcat instead
To be as close as possible with the real migration for this customer, I took, as input, a few of the smallest documents that will be imported, a few of the biggest (300 times bigger than the smallest) and a few around the average size (30 times bigger than the smallest). I also took different mimetypes like PDF, XML, TXT and the associated expected metadata for all of these. These documents are all using a custom type with ~10 custom properties.
I love bash/shell scripting, it’s definitively not the fastest solution (C/C++, Go, Python, Perl or even Java would be faster) but it’s still decent and above all, it’s simple, so that’s what I used. The goal isn’t to have the best performance here, but just to compare apples to apples. The script itself is pretty simple, it defines a few variables like the REST-API URL to use (which depends on the Access Method chosen), the parent folder under which imports will be done, the username and asks for a password. It takes three parameters as command line arguments, the Access Method to be used, the type of documents to import (small/average/large sizes) and the number of documents to create in Alfresco. For example:
## script_name --access_method --doc_size nb_doc_to_import
./alf_import.sh --apache-https-lb --small 1000
./alf_import.sh --apache-http-lb --average 1000
./alf_import.sh --direct --large 1000
./alf_import.sh --apache-https-nolb --small 1000
./alf_import.sh --apache-http-nolb --small 1000
With these parameters, the script would select the templates to use and their associated metadata and then start a timer and a loop to import all the documents, in a single-thread (meaning 1 after the other). As soon as the last document has been imported, it would stop the timer and provide the import time as outcome. It’s really nothing complex, around 20 lines of code, simple and straightforward.
IV. Results – HTTPS vs HTTP & different access methods – Single-threadI did 3 runs of 1000 documents, for each combination possible (between the access method and the document size). I then took the average execution time for the 3 runs which I transformed into an import speed (Docs/sec). The resulting graph looked like that:
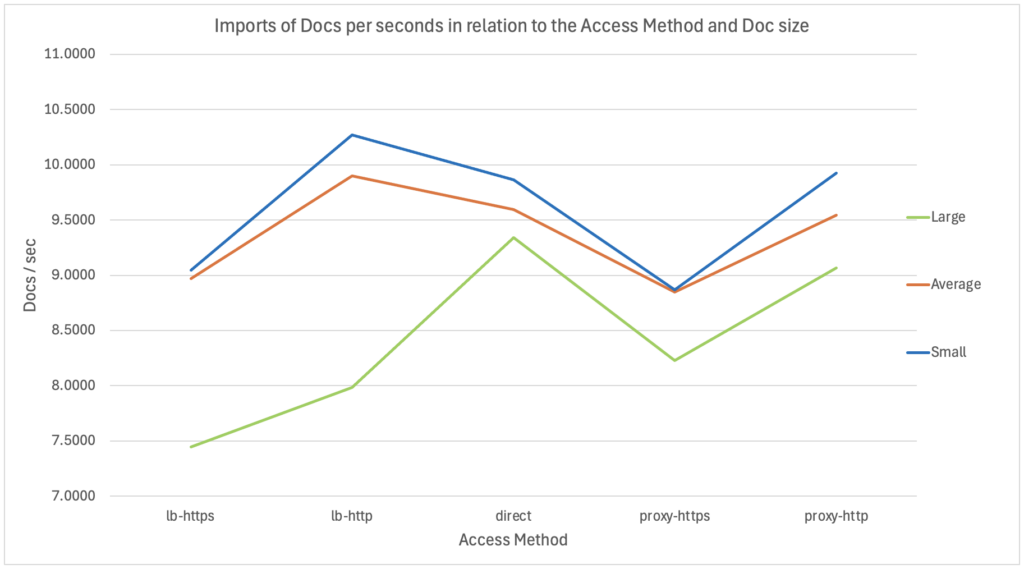
As a reminder, this is a single-thread import using REST-API inside a bash/shell script executed from a remote server (through the Network). So, what can we see on these results?
- First, and as I expected, we can see around 10/15% degradation when using HTTPS instead of HTTP.
- Then, between the smallest and the average size documents, we can only see a very small difference (with the same access method): around 1-3%. Which could indicate that the network might not be the limiting factor when documents aren’t too big, since the documents size increased by 30 times while the import speed is “only” 1-3% slower.
- A third interesting point is that with bigger files, the import is noticeably slower. That’s especially true when using the Load Balancing methods, as that means that irrespective of which Apache HTTPD we are talking to, there will be 50% of the requests going to the local Alfresco Node while the remaining 50% will be redirected to the second, remote, Alfresco Node. Therefore, the bigger the document, the slower it will be compared to other methods, as for 50% of the requests, it will need to transfer the document through the network twice (client -> Apache HTTPD + Apache HTTPD -> remote Alfresco Node). With the large documents, the size increased by 10 times (vs average) and the import speed is 10-25% slower.
- In relation to the previous point, there is another interesting thing to note for the small/medium documents. Indeed, even with a single thread execution, using the Load Balancing method is actually 3-4% faster than the direct access to Tomcat and than a plain Reverse Proxy. How could that be? If we consider the network, it should be slower, no? I believe this shows that the Apache HTTPD implementation of the Load Balancing via “mod_jk” is really the most efficient way to access an Apache Tomcat. This difference would probably be even more exacerbated with multi-threads, while doing Load Tests / Stress Tests.
With the previous script, it was possible to test different import/access methods, but it was only using a single thread. This means that new requests would only come in when the previous one was already completed, and the result was returned to the client. That’s obviously not like that in reality, as you might have several users working at the same time, on different things. In terms of Migration, to increase the import speed, you will also most probably have a multi-threaded architecture as it can drastically reduce the time required. In a similar approach, the customer also wanted to see how the system behaves when we add several importers running in parallel.
Therefore, I used a second script, a wrapper of sort, that would trigger/manage/monitor multiple threads executing the first script. The plan is, of course, to provide the exact same command line arguments as before, but we would also need a new one for the number of threads to start. For example:
## script_name --access_method --doc_size nb_doc_to_import nb_threads
./alf_multi_thread.sh --apache-https-lb --small 1000 2
./alf_multi_thread.sh --apache-http-lb --average 1000 6
Most parameters would just be forwarded to the first script, except for the number of threads (obviously) and the number of documents to import. To keep things consistent, the parameter “nb_doc_to_import” should still represent the total number of documents to import and not the number per thread. This is because if you try to import 1000 documents on 6 threads, for example, you will be able to do either 996 (6166) documents or 1002 (6167) but not 1000… Giving 1000 documents to import, the script would do some division with remainder so that the threads #1, #2, #3 and #4 would import 167 documents while the threads #5 and #6 would only import 166 documents. This distribution would be calculated first and then all threads would be started at the same time (+/- 1ms). The script would then monitor the progress of the different threads and report the execution time when everything is completed.
VI. Results – Scaling the import – Multi-threadsAs previously, I did 3 imports of 1000 documents each of took the average time. I executed the imports for 1 to 10 threads as well as 15, 20, 30, 50, 70, 90 and 100 threads. In addition, I did all that with both 1 Alfresco Node or 2 Alfresco Nodes, to be able to compare the speed if only 1 Tomcat is serving 100% of the requests or if the load is shared 50/50. The resulting graph looked like that:
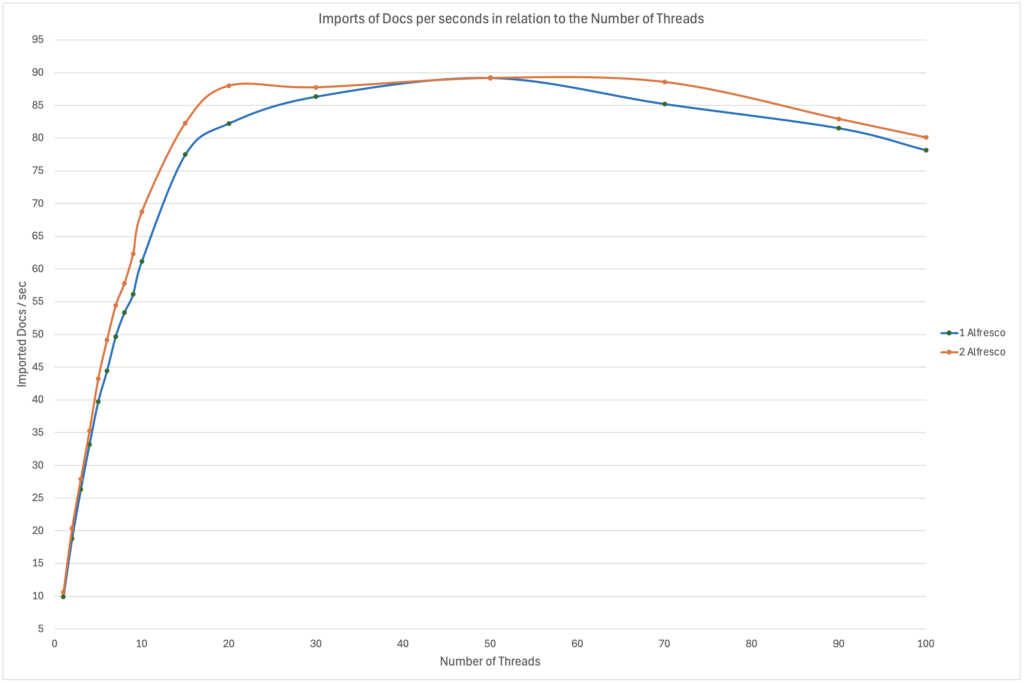
So, what can we see on these results?
- It’s pretty clear that the ingestion speed is increasing in an almost linear way from 1 to ~8/10 threads. The increase then slows down between 10 and 50 threads before the import speed actually starts decreasing from 70 parallel threads. The limit reached and the number of threads seen might just be related to the fact that I was using a bash/shell script and the fact that the OS on which I was running the importer (my client workstation) was obviously limited in terms of processing power. I had only 4 CPUs, so when you try to run 20/50/70 threads on it, it’s bound to reach a threshold where your threads are actually just waiting for some CPU time before it gets executed. Therefore, adding more might not improve the performance and it might actually Have the opposite effect.
- There isn’t much difference in terms of ingestion speed whether we used only 1 or 2 Alfresco Node(s). With 1 to 4 threads, it was ~6% faster to use 2 Alfresco Nodes. From 5 to 10 threads, the gap widens a bit but, in the end, the maximum difference was only ~10%. After 10 parallel threads, the gap reduces again and then the threshold/limit is pretty much the same. You might think something like: “Why is it not 2x faster to use 2 Alfresco Nodes?”. Well, it’s just not enough threads. Whether you are running 6 threads on 1 Alfresco Node or 3 threads on each of 2 Alfresco Nodes (3×2=6), it’s just not enough to see a big difference. The number of threads is fixed, so you need to compare 6 threads in total. With that in mind, this test isn’t sufficient because we are far from what Tomcat can handle and that means the small difference seen is most probably coming from the client I was using and not Alfresco.
In summary, what is the limiting factor here? The CPU of my client workstation? The networking? The Clustering? The DB? It’s pretty hard to say without further testing. For example, adding more CPU and/or other client workstations to spread the source of the requests. Or removing the clustering on this environment so that Alfresco doesn’t need to maintain the clustering-related caches and other behaviours required. In the end, the customer just wanted to get an idea of how the import speed increases with additional threads, so the limit wasn’t really relevant here.
As a closing comment, it actually took much more time to run the tests and gather/analyse the results than to create the scripts used. As mentioned previously, if you would like to do real Load Tests / Stress Tests (or something quick&dirty as here :D), don’t hesitate to contact us, some of my colleagues would be very happy to help.
L’article Alfresco – Impact of SSL and LB on the import perf. est apparu en premier sur dbi Blog.
Automatic Transaction Rollback in Oracle Database 23ai
In the Oracle Database 23ai Enterprise Edition, it is now possible to automatically rollback some transactions, and a set of new parameters have been added to control this behavior.
Of course implementing this feature requires deep understanding of your application, data model and source code.
The general idea :* We don’t want critical transactions to be delayed for too long due to row locks caused by less important transactions.
* The new parameters would allow us to define if a transaction T1 is considered more important than a transaction T2.
* The new parameters would also let us set waiting thresholds, specifying how many seconds T1 will wait for the less important T2 to release the lock before forcing a rollback.
The parameters that are controlling this feature are :
txt_prioritytxn_auto_rollback_modetxn_auto_rollback_high_priority_wait_target txn_auto_rollback_medium_priority_wait_target Let’s see what each parameter means :
1-TXN_PRIORITY
This is where we define each transaction importance, it is used at session level.
We use the alter session command; and HIGH is the default value.
SQL> alter session set txn_priority = HIGH;SQL> alter session set txn_priority = MEDIUM;SQL> alter session set txn_priority = LOW;2 – TXN_AUTO_ROLLBACK_HIGH_PRIORITY_WAIT_TARGET and TXN_AUTO_ROLLBACK_MEDIUM_PRIORITY_WAIT_TARGET :
These are the waiting thresholds in seconds, defined at SYSTEM level.
They controls how many seconds would a high or medium transaction wait for a lesser important transaction over the same row locks.
These targets have the following characteristics :
* The minimum possible value is 1. (1 second)
* It can be set at PDB level, so pluggable databases can have different thresholds.
* In a RAC database, instances can also be set at different values.
For instance, to set a target of 30 seconds for high priority transactions :
SQL> alter system set txn_auto_rollback_high_priority_wait_target = 30;It is very important to note that this does NOT mean a high priority transaction will always wait for “only” 30 seconds.
For instance :
If you have a high transaction T1 waiting for a medium transaction T2, which is waiting for a low transaction T3, all for the same row locks, then the 30 seconds count will only start when T2 receive the lock, so you have to add also the time when T2 had been itself waiting for T3.
3- TXN_AUTO_ROLLBACK_MODE :
This is the feature’s mode, and it is defined at system level.
It may have as a value : “ROLLBACK” (the default) or “TRACK”.
If you set the mode at ‘track’, then the feature will just track and report the cases, no automatic rollback will happen.
So this mode (TRACK) could be a great way to test the feature’s effect before properly implementing it.
This parameter has the following characteristics :
* it is pdb mofifiable, so each pluggable database can have a different value.
* However RAC instances MUST have the same value.
We will do a simple test : We will make a low priority session (Session 1) update a row without commiting, and then try to update the same row in a high priority session (Session 2).
We will also use this case to illustrate that the thresholds are PDB defined, and to check some ways to see statistics about rollback operations.
Let’s connect to our root container and set the priority waiting parameters :
[oracle@localhost ~]$ sqlplus / as sysdba


SQL> alter system set "txn_auto_rollback_high_priority_wait_target"=300;

System altered.

SQL> alter system set "txn_auto_rollback_medium_priority_wait_target"=300;

System altered.

SQL> select name,value from v$parameter where name like '%txn_priority%';

NAME                                                         VALUE
------------------------------------------------------------ ------------------------------------------------------------
txn_priority                                                 HIGH
txn_auto_rollback_high_priority_wait_target                  300
txn_auto_rollback_medium_priority_wait_target                300
The session priority is at HIGH because it is the default, and we have not changed it.
Now let’s connect to our pluggable database and verify our values :
SQL> alter session set container=DEVPDB;

Session altered.

SQL> select name,value from v$parameter where name like '%txn_priority%';

NAME                                                         VALUE
------------------------------------------------------------ ------------------------------------------------------------
txn_priority                                                 HIGH
txn_auto_rollback_high_priority_wait_target                  2147483647
txn_auto_rollback_medium_priority_wait_target                2147483647
The waiting values are different, because it is a pluggable level defined value, 2147483647 seconds is the default. let’s set it at 4 minutes :
SQL> alter system set "txn_auto_rollback_high_priority_wait_target"=160;

System altered.

SQL> alter system set "txn_auto_rollback_medium_priority_wait_target"=160;

System altered.

SQL> select name,value from v$parameter where name like '%txn_priority%';

NAME                                                         VALUE
------------------------------------------------------------ ------------------------------------------------------------
txn_priority                                                 HIGH
txn_auto_rollback_high_priority_wait_target                  160
txn_auto_rollback_medium_priority_wait_target                160
Now let’s set our current session at LOW priority and then make an update query without doing a commit or rollback :
-- Session 1 : Low priority
SQL> alter session set "txn_priority"="LOW";

SQL> select name,value from v$parameter where name like '%txn_priority%';

NAME                                                         VALUE
------------------------------------------------------------ ------------------------------------------------------------
txn_priority                                                 LOW
txn_auto_rollback_high_priority_wait_target                  160
txn_auto_rollback_medium_priority_wait_target                160

SQL> update hr.EMPLOYEES set SALARY=10000 where EMPLOYEE_ID=102;

1 row updated.

SQL>
Now let’s connect to a new session on the same pluggable database, and try to update the same row :
-- Session 2 : High Priority
SQL> select name,value from v$parameter where name like '%txn_priority%';

NAME                                                         VALUE
------------------------------------------------------------ ------------------------------------------------------------
txn_priority                                                 HIGH
txn_auto_rollback_high_priority_wait_target                  160
txn_auto_rollback_medium_priority_wait_target                160

SQL> update hr.EMPLOYEES set SALARY=9000 where EMPLOYEE_ID=102;
=> The prompt will not return as the session is waiting for session 1
Back in session 1, you can see the blocking information, please note the specific EVENT (row high priority)
SQL> select sid,event,seconds_in_wait,blocking_session from v$session where event like '%enq%';

       SID EVENT
---------- ----------------------------------------------------------------
SECONDS_IN_WAIT BLOCKING_SESSION
--------------- ----------------
        42 enq: TX - row (HIGH priority)
            132              197
After 4 minutes the prompt in session 2 will return, the query in session 1 had been rollbacked.
if you try to do a commit in session 1, you will receive an ORA-03135 error (Connection lost contact)
-- session 1
SQL> commit;
commit
*
ERROR at line 1:
ORA-03135: connection lost contact
Process ID: 4905
Session ID: 197 Serial number: 46817
Help : https://docs.oracle.com/error-help/db/ora-03135/

SQL>
Back in session 2, you can do your commit and check the value of the row :
-- Session 2
SQL> commit;

Commit complete.

SQL> select SALARY from hr.EMPLOYEES where EMPLOYEE_ID=102;

    SALARY
----------
      9000
For statistics about how many rollbacks did you have overall, you can query the v$sysstat view
SQL> select * from v$sysstat where name like '%txns rollback%';

STATISTIC# NAME                                                                  CLASS      VALUE    STAT_ID     CON_ID
---------- ---------------------------------------------------------------- ---------- ---------- ---------- ----------
      1894 txns rollback priority_txns_high_wait_target                            384          5  312271427          3
      1895 txns rollback priority_txns_medium_wait_target                          384          2 3671782541          3

SQL>
In this case, in our pluggable database (con_id=3) :
– 2 times did a medium priority transaction caused the rollback of a low priority transaction.
– 5 times did a high priority transaction caused the rollback of either a medium or low priority transaction.
If you have set you feature’s mode as “TRACK” instead of “ROLLBACK”, then you should search statistics that are like ‘%txns track%’ instead :
SQL> select * from v$sysstat where name like '%txns track%';

STATISTIC# NAME                                                                  CLASS      VALUE    STAT_ID     CON_ID
---------- ---------------------------------------------------------------- ---------- ---------- ---------- ----------
      1896 txns track mode priority_txns_high_wait_target                          384          0 2659394049          3
      1897 txns track mode priority_txns_medium_wait_target                        384          0 1855585812          3
In this case, no occurrences because I did not used it. As mentioned before, this mode (TRACK) could be a great way to test “What would happen” if you implement the feature without causing any rollbacks.
L’article Automatic Transaction Rollback in Oracle Database 23ai est apparu en premier sur dbi Blog.
Hot Clone of a Remote PDB in a Dataguard Environment 19c
In Oracle Database 19c, if you have a Dataguard Configuration of a multitenant database, and you want to clone a pluggable database from a remote server to your primary, then you have to mind that the dataguard mechanism is about applying redo, not copying datafiles : After you execute the clone, the new cloned pluggable will be useless on the standby site.
you can verify that the clone’s standby contains no datafiles by quering the v$datafile view.
You would get something like this :
SQL> select name from v$datafile where con_id=4;

NAME
--------------------------------------------------------------
/opt/oracle/product/19c/dbhome_1/dbs/UNNAMED00044
/opt/oracle/product/19c/dbhome_1/dbs/UNNAMED00045
/opt/oracle/product/19c/dbhome_1/dbs/UNNAMED00046
The tricky part is that you might not be aware of this, because the dataguard broker will tell you the configuration is fine, and the validate command will confirm that the standby is ready for switchover. (The swithover will indeed work, but you won’t be able to open the new cloned pluggable in the standby site).
One possible solution, if you don’t want to rebuild your standby database after the clone, is to use a transient pluggable copy.
The idea is to :
– First do a clone to a temporary pluggable (or transient) in your primary, using a database link to your remote database.
– Define a “self-refering” database link in your primary database.
– Use this database link to create your pluggable database, which will be usable also on the standby.
It’s not complicated but it requires many steps, so let’s see how it’s done :
The procedureLet’s consider this example :
– We have a multitenant database called QUALCDB :
SQL> select name from v$database;

NAME
---------
QUALCDB

SQL> show pdbs

    CON_ID CON_NAME                       OPEN MODE  RESTRICTED
---------- ------------------------------ ---------- ----------
         2 PDB$SEED                       READ ONLY  NO
         3 QUAL_PDB1                      READ WRITE NO
SQL>
This database is protected by a dataguard configuration :
Configuration - qualcdb

  Protection Mode: MaxPerformance
  Members:
  QUALCDB_SITE1 - Primary database
    QUALCDB_SITE2 - Physical standby database

Fast-Start Failover:  Disabled

Configuration Status:
SUCCESS   (status updated 14 seconds ago)
– And a multitenant database called PRODCDB on a remote server, this would be the source of our clone :
SQL> select name from v$database;

NAME
---------
PRODCDB

SQL> show pdbs

    CON_ID CON_NAME                       OPEN MODE  RESTRICTED
---------- ------------------------------ ---------- ----------
         2 PDB$SEED                       READ ONLY  NO
         4 PROD_PDB1                      READ WRITE NO
         5 PROD_PDB2                      READ WRITE NO
SQL>
Our objective is to clone PROD_PDB2 into the primary QUALCDB database as QUAL_PDB2, bellow we will execute the following procedure :
– Clone the pluggable PROD_PDB2 to TEMP_QUAL2 on the primary QUALCDB, so this is the clone that is fine on the primary, but useless on the standby
– Create a Database link from the QUALCDB Primary to itself.
– Give this database link as a parameter to the standby database.
– Use this database link to clone TEMP_QUAL2 to our final pluggable QUAL_PDB2, this would our final clone that is fine on the standby.
Let’s do it step by step :
1 – In the source PRODCDB, we create a user that would execute the clone :
-- On the Remote prodcdb database
SQL> grant create session, sysoper to C##PDBCLONE identified by Welcome__001 container=all;

Grant succeeded.

SQL>
2- In the destination QUALCDB, we create a database link to the PRODCDB database :
-- On the Primary
SQL> CREATE DATABASE LINK "DBLINK_TO_REMOTEDB" CONNECT TO "C##PDBCLONE" IDENTIFIED BY "Welcome__001" USING 'your_tns_string_to_PRODCDB';

Database link created.
3- We open the root standby in read only :
Please note that in 19c, the Active Data Guard option license is not required when only the CDB$ROOT and PDB$SEED are opened in read only, as long as you ensure that the other users PDBs are always closed when apply is on.
You can find valuable details and ways to test that in this blog : dbi-services blog
-- On the standby
SQL> show pdbs

    CON_ID CON_NAME                       OPEN MODE  RESTRICTED
---------- ------------------------------ ---------- ----------
         2 PDB$SEED                       MOUNTED
         3 QUAL_PDB1                      MOUNTED

SQL> alter database open read only;

Database altered.

SQL> show pdbs

    CON_ID CON_NAME                       OPEN MODE  RESTRICTED
---------- ------------------------------ ---------- ----------
         2 PDB$SEED                       READ ONLY  NO
         3 QUAL_PDB1                      MOUNTED
SQL>
4- We clone prod_pdb2 to a transient database, using the STANDBYS=NONE clause, let’s name the clone TEMP_QUAL2
SQL> select name from v$database;

NAME
---------
QUALCDB

SQL> show con_name

CON_NAME
------------------------------
CDB$ROOT
SQL>

SQL> create pluggable database TEMP_QUAL2 from PROD_PDB2@DBLINK_TO_REMOTEDB STANDBYS=NONE;

Pluggable database created.

SQL> alter pluggable database TEMP_QUAL2 open;

Pluggable database altered.

SQL> show pdbs

    CON_ID CON_NAME                       OPEN MODE  RESTRICTED
---------- ------------------------------ ---------- ----------
         2 PDB$SEED                       READ ONLY  NO
         3 QUAL_PDB1                      READ WRITE NO
         4 TEMP_QUAL2                     READ WRITE NO
5- We want to create our QUAL_PDB2 from TEMP_QUAL2, but The temp_qual2 datafiles do not exist on the standby server, so we need something beyond the dataguard redo apply to make it work, this is provided by the standby_pdb_source_file_dblink parameter.
First, we define a “self-db-link” from the primary container to “itself” :
-- On the Primary
SQL> show con_name

CON_NAME
------------------------------
CDB$ROOT

SQL> grant create session, sysoper to C##PDBCLONE identified by Welcome__001 container=all;

Grant succeeded.

SQL> CREATE DATABASE LINK "SELF_DBLINK" CONNECT TO "C##PDBCLONE" IDENTIFIED BY Welcome__001 USING 'your_primary_database_tns';

Database link created.

SQL>
Then we set the standby_pdb_source_file_dblink parameter to this dblink on the standby :
--On the standby
SQL> alter system set standby_pdb_source_file_dblink='SELF_DBLINK' scope=both;

System altered.

SQL>
Now we can create our pluggable using the STANDBYS=ALL clause, please note it is important in this case to restart temp_qual2 in read only mode even if you are not updating it
--On the Primary
SQL> alter pluggable database TEMP_QUAL2 close;

Pluggable database altered.

SQL> alter pluggable database TEMP_QUAL2 open read only;

Pluggable database altered.

SQL> create pluggable database QUAL_PDB2 from TEMP_QUAL2 STANDBYS=ALL;

Pluggable database created.

SQL> show pdbs

    CON_ID CON_NAME                       OPEN MODE  RESTRICTED
---------- ------------------------------ ---------- ----------
         2 PDB$SEED                       READ ONLY  NO
         3 QUAL_PDB1                      READ WRITE NO
         4 TEMP_QUAL2                     READ WRITE NO
         5 QUAL_PDB2                      MOUNTED
SQL> alter pluggable database QUAL_PDB2 open;

Pluggable database altered.
And we are done ! the pluggable standby is OK and contains the files :
SQL> show pdbs

    CON_ID CON_NAME                       OPEN MODE  RESTRICTED
---------- ------------------------------ ---------- ----------
         2 PDB$SEED                       MOUNTED
         3 QUAL_PDB1                      MOUNTED
         4 TEMP_QUAL2                     MOUNTED
         5 QUAL_PDB2                      MOUNTED

SQL> select name from v$datafile where con_id=5;

NAME
--------------------------------------------------------------------------------
/u02/oradata/QUALCDB/QUALCDB_SITE2/0436816C267F1805E06571B1CAD248EB/datafile/o1_
mf_system_mbd8pzd9_.dbf

/u02/oradata/QUALCDB/QUALCDB_SITE2/1E4D5E04CFDD140AE06573A0AEC465A5/datafile/o1_
mf_sysaux_mbd8pzd9_.dbf

/u02/oradata/QUALCDB/QUALCDB_SITE2/1E4D5E04CFDD140AE06573A0AEC465A5/datafile/o1_
mf_undotbs1_mbd8pzdb_.dbf
At the end, you might want to delete the temporary TEMP_QUAL2 database, and to restart your standby in mount mode if you don’t have the Active Dataguard Licence :
--On the Primary
SQL> alter pluggable database TEMP_QUAL2 close;

Pluggable database altered.

SQL> drop pluggable database TEMP_QUAL2 including datafiles;

Pluggable database dropped.

SQL>

-- On the standby

SQL> shutdown immediate
Database closed.
Database dismounted.
ORACLE instance shut down.
SQL> startup mount
ORACLE instance started.

Total System Global Area 1157627856 bytes
Fixed Size                  9134032 bytes
Variable Size             318767104 bytes
Database Buffers          822083584 bytes
Redo Buffers                7643136 bytes
Database mounted.
SQL>
Final Considerations
– You might prefer to clone your pluggable, then re-create the standby database. This is indeed more straightforward. However, you might use the procedure of this blog if you have Disaster Recovery obligations that force you to keep your standby up and ready all the time, or if your database is too big.
– Starting from 21c, A new feature “PDB Recovery Isolation” solves the problem, a “normal hot clone” is enough. BUT, this feature is only available within the Active Dataguard Licence. Please check this for more details :
Oracle Database Documentation
L’article Hot Clone of a Remote PDB in a Dataguard Environment 19c est apparu en premier sur dbi Blog.
And what about cloning a PDB in a Data Guard environment on ExaCC?
I have recently blogged about how to create a new PDB on ExaCC in a Data Guard environment, see https://www.dbi-services.com/blog/create-new-pdb-in-a-data-guard-environment-on-exacc/.
And what about if I clone a PDB on the primary CDB? Let’s see.
Read more: And what about cloning a PDB in a Data Guard environment on ExaCC? Clone PDB on the primary databaseLet’s clone our previous NEWPDB into NEWPDB_2 with dbaascli.
oracle@ExaCC-chz1-cl01n1:~/ [MYCDB1 (CDB$ROOT)] dbaascli pdb localclone --pdbName NEWPDB --dbName MYCDB --targetPDBName NEWPDB_2
DBAAS CLI version 24.1.2.0.0
Executing command pdb localclone --pdbName NEWPDB --dbName MYCDB --targetPDBName NEWPDB_2
Job id: 584e3b45-7725-4132-a865-88b20a559e4e
Session log: /var/opt/oracle/log/MYCDB/pdb/localClone/dbaastools_2024-05-31_10-56-38-AM_394962.log
Loading PILOT...
Session ID of the current execution is: 7855
Log file location: /var/opt/oracle/log/MYCDB/pdb/localClone/pilot_2024-05-31_10-56-49-AM_399103
-----------------
Running Plugin_initialization job
Enter TDE_PASSWORD:                                                                                                                                                                                            *********************
Completed Plugin_initialization job
-----------------
Running Validate_input_params job
Completed Validate_input_params job
-----------------
Running Validate_target_pdb_service_name job
Completed Validate_target_pdb_service_name job
-----------------
Running Perform_dbca_prechecks job
Completed Perform_dbca_prechecks job
Acquiring read lock: _u02_app_oracle_product_19.0.0.0_dbhome_2
Acquiring write lock: mycdb
Acquiring write lock: newpdb_2
-----------------
Running PDB_creation job
Completed PDB_creation job
-----------------
Running Load_pdb_details job
Completed Load_pdb_details job
-----------------
Running Configure_pdb_service job
Completed Configure_pdb_service job
-----------------
Running Configure_tnsnames_ora job
Completed Configure_tnsnames_ora job
-----------------
Running Set_pdb_admin_user_profile job
Completed Set_pdb_admin_user_profile job
-----------------
Running Lock_pdb_admin_user job
Completed Lock_pdb_admin_user job
-----------------
Running Register_ocids job
Skipping. Job is detected as not applicable.
-----------------
Running Prepare_blob_for_standby_in_primary job
Completed Prepare_blob_for_standby_in_primary job
Releasing lock: newpdb_2
Releasing lock: mycdb
Releasing lock: _u02_app_oracle_product_19.0.0.0_dbhome_2
-----------------
Running Generate_dbsystem_details job
Acquiring native write lock: global_dbsystem_details_generation
Releasing native lock: global_dbsystem_details_generation
Completed Generate_dbsystem_details job
---------- PLUGIN NOTES ----------
Note: Pluggable database operation is performed on the primary database. In order to successfully complete the operation, the file /var/opt/oracle/log/reg_tmp_files/MYCDB_2024-05-31_10-56-49-AM_399103.tar needs to be copied to the standby database node and additional steps need to be run on all standby databases. Refer to the Cloud Service documentation for the complete steps.
---------- END OF PLUGIN NOTES ----------
dbaascli execution completed
Checks
Let’s check new clone on the primary side:
oracle@ExaCC-chz1-cl01n1:~/ [MYCDB1 (CDB$ROOT)] sqh

SQL*Plus: Release 19.0.0.0.0 - Production on Fri May 31 11:00:12 2024
Version 19.23.0.0.0

Copyright (c) 1982, 2023, Oracle.  All rights reserved.


Connected to:
Oracle Database 19c EE Extreme Perf Release 19.0.0.0.0 - Production
Version 19.23.0.0.0

SQL> show pdbs

    CON_ID CON_NAME                       OPEN MODE  RESTRICTED
---------- ------------------------------ ---------- ----------
         2 PDB$SEED                       READ ONLY  NO
         3 PDB1                           READ WRITE NO
         4 PDB2                           READ WRITE NO
         5 PDB3                           READ WRITE NO
         6 NEWPDB                         READ WRITE NO
         7 NEWPDB_2                       READ WRITE NO
SQL>
And on the standby side:
oracle@ExaCC-chz2-cl01n1:~/ [MYCDB1 (CDB$ROOT)] sqh

SQL*Plus: Release 19.0.0.0.0 - Production on Fri May 31 11:00:41 2024
Version 19.23.0.0.0

Copyright (c) 1982, 2023, Oracle.  All rights reserved.


Connected to:
Oracle Database 19c EE Extreme Perf Release 19.0.0.0.0 - Production
Version 19.23.0.0.0

SQL> show pdbs

    CON_ID CON_NAME                       OPEN MODE  RESTRICTED
---------- ------------------------------ ---------- ----------
         2 PDB$SEED                       READ ONLY  NO
         3 PDB1                           READ ONLY  NO
         4 PDB2                           READ ONLY  NO
         5 PDB3                           READ ONLY  NO
         6 NEWPDB                         READ ONLY  NO
         7 NEWPDB_2                       MOUNTED

SQL> select name, total_size/1024/1024/1024 GB from v$pdbs;

NAME                         GB
-------------------- ----------
PDB$SEED             1.85546875
PDB1                 2308.65039
PDB2                 1534.89966
PDB3                 1095.55273
NEWPDB               4.34375
NEWPDB_2             0

6 rows selected.
As expected the PDB clone on the standby side has been created with the Data Guard redo, but is empty.
Resolve the problemLet’s transfer the BLOB file the initial commands provided us. The file is here:
[opc@ExaCC-chz2-cl01n1 ~]$ sudo mv /tmp/MYCDB_2024-05-31_10-56-49-AM_399103.tar /var/opt/oracle/log/reg_tmp_files/
[opc@ExaCC-chz2-cl01n1 ~]$ sudo chown oracle: /var/opt/oracle/log/reg_tmp_files/MYCDB_2024-05-31_10-56-49-AM_399103.tar
With the blob file as reference, clone the PDB on the standby side. It is the exact same command used on the primary side, with just an additional command --standbyBlobFromPrimary.
oracle@ExaCC-chz2-cl01n1:~/ [MYCDB1 (CDB$ROOT)] ls -ltrh /var/opt/oracle/log/reg_tmp_files/MYCDB_2024-05-31_10-56-49-AM_399103.tar
-rw-r--r-- 1 oracle oinstall 160K May 31 11:03 /var/opt/oracle/log/reg_tmp_files/MYCDB_2024-05-31_10-56-49-AM_399103.tar

oracle@ExaCC-chz2-cl01n1:~/ [MYCDB1 (CDB$ROOT)] dbaascli pdb localclone --pdbName NEWPDB --dbName MYCDB --targetPDBName NEWPDB_2 --standbyBlobFromPrimary /var/opt/oracle/log/reg_tmp_files/MYCDB_2024-05-31_10-56-49-AM_399103.tar
DBAAS CLI version 24.1.2.0.0
Executing command pdb localclone --pdbName NEWPDB --dbName MYCDB --targetPDBName NEWPDB_2 --standbyBlobFromPrimary /var/opt/oracle/log/reg_tmp_files/MYCDB_2024-05-31_10-56-49-AM_399103.tar
Job id: eabccc30-af71-4d49-ba59-e3fce15c0619
Session log: /var/opt/oracle/log/MYCDB/pdb/localClone/dbaastools_2024-05-31_11-07-21-AM_398735.log
Loading PILOT...
Session ID of the current execution is: 5625
Log file location: /var/opt/oracle/log/MYCDB/pdb/localClone/pilot_2024-05-31_11-07-34-AM_1320
-----------------
Running Plugin_initialization job
Enter SYS_PASSWORD:                                                                                                                                                                                              ************************
Enter TDE_PASSWORD:                                                                                                                                                                                                     *********************
Completed Plugin_initialization job
-----------------
Running Validate_input_params job
Completed Validate_input_params job
-----------------
Running Validate_target_pdb_service_name job
Completed Validate_target_pdb_service_name job
-----------------
Running Perform_dbca_prechecks job
Completed Perform_dbca_prechecks job
Acquiring read lock: _u02_app_oracle_product_19.0.0.0_dbhome_2
Acquiring write lock: mycdb
Acquiring write lock: newpdb_2
-----------------
Running PDB_creation job
Completed PDB_creation job
-----------------
Running Load_pdb_details job
Completed Load_pdb_details job
-----------------
Running Configure_pdb_service job
Completed Configure_pdb_service job
-----------------
Running Configure_tnsnames_ora job
Completed Configure_tnsnames_ora job
-----------------
Running Set_pdb_admin_user_profile job
Skipping. Job is detected as not applicable.
-----------------
Running Lock_pdb_admin_user job
Skipping. Job is detected as not applicable.
-----------------
Running Register_ocids job
Skipping. Job is detected as not applicable.
-----------------
Running Prepare_blob_for_standby_in_primary job
Skipping. Job is detected as not applicable.
Releasing lock: newpdb_2
Releasing lock: mycdb
Releasing lock: _u02_app_oracle_product_19.0.0.0_dbhome_2
-----------------
Running Generate_dbsystem_details job
Acquiring native write lock: global_dbsystem_details_generation
Releasing native lock: global_dbsystem_details_generation
Completed Generate_dbsystem_details job
dbaascli execution completed
Final checks
And the new cloned PDB is also now opened READ ONLY on the standby side.
SQL> show pdbs

    CON_ID CON_NAME                       OPEN MODE  RESTRICTED
---------- ------------------------------ ---------- ----------
         2 PDB$SEED                       READ ONLY  NO
         3 PDB1                           READ ONLY  NO
         4 PDB2                           READ ONLY  NO
         5 PDB3                           READ ONLY  NO
         6 NEWPDB                         READ ONLY  NO
         7 NEWPDB_2                       READ ONLY  NO
SQL>
And the Data Guard is in sync.
oracle@ExaCC-chz1-cl01n1:~/ [MYCDB1 (CDB$ROOT)] dgh
DGMGRL for Linux: Release 19.0.0.0.0 - Production on Fri May 31 11:22:32 2024
Version 19.23.0.0.0

Copyright (c) 1982, 2019, Oracle and/or its affiliates.  All rights reserved.

Welcome to DGMGRL, type "help" for information.

DGMGRL> connect /
Connected to "MYCDB_CHZ1"
Connected as SYSDG.

DGMGRL> show configuration lag

Configuration - fsc

  Protection Mode: MaxAvailability
  Members:
  MYCDB_CHZ1 - Primary database
    MYCDB_CHZ2 - Physical standby database
                    Transport Lag:      0 seconds (computed 0 seconds ago)
                    Apply Lag:          0 seconds (computed 0 seconds ago)

Fast-Start Failover:  Disabled

Configuration Status:
SUCCESS   (status updated 44 seconds ago)
BLOB file contents
Let’s see what contains the blob file. The file contains the metadata architecture that will be used to recreate the PDB on the standby side.
[opc@svl-sirip614 chk_blob_exacc_MYCDB]$ ls -ltrh
total 132K
-rw-r--r--. 1 opc opc 130K May 31 13:43 MYCDB_2024-05-31_09-52-53-AM_101724.tar

[opc@svl-sirip614 chk_blob_exacc_MYCDB]$ tar xf MYCDB_2024-05-31_09-52-53-AM_101724.tar

[opc@svl-sirip614 chk_blob_exacc_MYCDB]$ ls
MYCDB_2024-05-31_09-52-53-AM_101724.tar  db_wallet  pwdmycdb_chz1.639.1169979391  wallet_root

[opc@svl-sirip614 chk_blob_exacc_MYCDB]$ tar tvf MYCDB_2024-05-31_09-52-53-AM_101724.tar
drwxr-x--- oracle/oinstall   0 2024-05-30 16:54 wallet_root/
drwxr-x--- oracle/oinstall   0 2024-05-31 09:54 wallet_root/tde/
-rw------- oracle/oinstall 15145 2024-05-31 09:54 wallet_root/tde/ewallet.p12
-rw------- oracle/oinstall 15190 2024-05-31 09:54 wallet_root/tde/cwallet.sso
-rw------- oracle/oinstall  2553 2024-05-26 10:24 wallet_root/tde/ewallet_2024052608245022.p12
-rw------- oracle/oinstall  3993 2024-05-26 10:31 wallet_root/tde/ewallet_2024052608313060.p12
-rw------- oracle/oinstall     0 2024-05-26 17:37 wallet_root/tde/ewallet.p12.lck
-rw------- oracle/oinstall     0 2024-05-26 17:37 wallet_root/tde/cwallet.sso.lck
-rw------- oracle/asmadmin  5465 2024-05-26 17:38 wallet_root/tde/ewallet_2024052615380164.p12
-rw------- oracle/asmadmin  6953 2024-05-26 17:55 wallet_root/tde/ewallet_2024052615552711.p12
-rw------- oracle/asmadmin  8201 2024-05-29 14:25 wallet_root/tde/ewallet_2024052912250856.p12
-rw------- oracle/asmadmin  9689 2024-05-29 15:34 wallet_root/tde/ewallet_2024052913345698.p12
-rw------- oracle/asmadmin 10937 2024-05-29 17:39 wallet_root/tde/ewallet_2024052915390341.p12
-rw------- oracle/asmadmin 12409 2024-05-29 18:05 wallet_root/tde/ewallet_2024052916054502.p12
-rw------- oracle/asmadmin 13673 2024-05-31 09:54 wallet_root/tde/ewallet_2024053107541551.p12
-rw-r----- oracle/oinstall   326 2024-05-26 10:32 wallet_root/cdb_ocids.json_20240526161751
-rw-r----- oracle/oinstall   326 2024-05-26 16:17 wallet_root/cdb_ocids.json
drwx------ oracle/oinstall     0 2024-05-27 16:22 wallet_root/195DC5B0E2F4976CE063021FA20AF881/
-rw-r----- oracle/oinstall   335 2024-05-27 16:22 wallet_root/195DC5B0E2F4976CE063021FA20AF881/pdb_ocids.json
drwx------ oracle/oinstall     0 2024-05-29 16:51 wallet_root/19971A75AFAC7611E063021FA20A7BDE/
-rw-r----- oracle/oinstall   335 2024-05-29 16:51 wallet_root/19971A75AFAC7611E063021FA20A7BDE/pdb_ocids.json
drwx------ oracle/oinstall     0 2024-05-30 16:54 wallet_root/1998B7B6E9770BF5E063021FA20A42A7/
-rw-r----- oracle/oinstall   335 2024-05-30 16:54 wallet_root/1998B7B6E9770BF5E063021FA20A42A7/pdb_ocids.json
drwxr-xr-x oracle/oinstall     0 2024-05-26 10:35 db_wallet/
-rw------- oracle/oinstall     0 2024-05-26 10:35 db_wallet/cwallet.sso.lck
-rw------- oracle/oinstall   619 2024-05-26 10:42 db_wallet/cwallet.sso
-rw-r----- grid/oinstall    2560 2024-05-31 09:55 pwdmycdb_chz1.639.1169979391

[opc@svl-sirip614 chk_blob_exacc_MYCDB]$ cat wallet_root/1998B7B6E9770BF5E063021FA20A42A7/pdb_ocids.json
{
  "tenancyOCID" : "ocid1.tenancy.oc1..aaaaaaaa52qxw***************************************************7wka",
  "compartmentOCID" : "ocid1.compartment.oc1..aaaaaaaadqt**************************************************7tqa",
  "resourceOCID" : "ocid1.pluggabledatabase.oc1.eu-zurich-1.an5he************************************************5na"
}

[opc@svl-sirip614 chk_blob_exacc_MYCDB]$ cat wallet_root/cdb_ocids.json
{
  "tenancyOCID" : "ocid1.tenancy.oc1..aaaaaaaa52qxw**************************************************7wka",
  "compartmentOCID" : "ocid1.compartment.oc1..aaaaaaaadqt2s**************************************************7tqa",
  "resourceOCID" : "ocid1.database.oc1.eu-zurich-1.an5helj**************************************************a3mq"
}
To wrap up
Clone a PDB in a CDB on ExaCC is the same procedure than creating a new PDB.
L’article And what about cloning a PDB in a Data Guard environment on ExaCC? est apparu en premier sur dbi Blog.
Create new PDB in a Data Guard environment on ExaCC
In this blog, I would like to share how to create a new PDB in one CDB in a Data Guard environment on the ExaCC.
Read more: Create new PDB in a Data Guard environment on ExaCC Naming ConventionFollowing is the naming convention:
- CDB Name is MYCDB
- ExaCC Primary site cluster is ExaCC-chz1-cl01
- ExaCC Standby site cluster is ExaCC-chz2-cl01
I will create a new PDB named NEWPDB in the CDB named MYCDB using dbaascli. This will be run on the primary site.
oracle@ExaCC-chz1-cl01n1:~/ [MYCDB1 (CDB$ROOT)] dbaascli pdb create --pdbName NEWPDB --dbName MYCDB
DBAAS CLI version 24.1.2.0.0
Executing command pdb create --pdbName NEWPDB --dbName MYCDB
Job id: e5eaa683-e31d-4c5a-962e-a568221653d9
Session log: /var/opt/oracle/log/MYCDB/pdb/create/dbaastools_2024-05-31_09-52-40-AM_96261.log
Loading PILOT...
Session ID of the current execution is: 7852
Log file location: /var/opt/oracle/log/MYCDB/pdb/create/pilot_2024-05-31_09-52-53-AM_101724
-----------------
Running Plugin_initialization job
Enter TDE_PASSWORD:                                                                                                                                                                                            *********************
Completed Plugin_initialization job
-----------------
Running Validate_input_params job
Completed Validate_input_params job
-----------------
Running Validate_target_pdb_service_name job
Completed Validate_target_pdb_service_name job
-----------------
Running Perform_dbca_prechecks job
Completed Perform_dbca_prechecks job
Acquiring read lock: _u02_app_oracle_product_19.0.0.0_dbhome_2
Acquiring write lock: mycdb
Acquiring write lock: newpdb
-----------------
Running PDB_creation job
Completed PDB_creation job
-----------------
Running Load_pdb_details job
Completed Load_pdb_details job
-----------------
Running Configure_pdb_service job
Completed Configure_pdb_service job
-----------------
Running Configure_tnsnames_ora job
Completed Configure_tnsnames_ora job
-----------------
Running Set_pdb_admin_user_profile job
Completed Set_pdb_admin_user_profile job
-----------------
Running Lock_pdb_admin_user job
Completed Lock_pdb_admin_user job
-----------------
Running Register_ocids job
Skipping. Job is detected as not applicable.
-----------------
Running Prepare_blob_for_standby_in_primary job
Completed Prepare_blob_for_standby_in_primary job
Releasing lock: newpdb
Releasing lock: mycdb
Releasing lock: _u02_app_oracle_product_19.0.0.0_dbhome_2
-----------------
Running Generate_dbsystem_details job
Acquiring native write lock: global_dbsystem_details_generation
Releasing native lock: global_dbsystem_details_generation
Completed Generate_dbsystem_details job
---------- PLUGIN NOTES ----------
Note: Pluggable database operation is performed on the primary database. In order to successfully complete the operation, the file /var/opt/oracle/log/reg_tmp_files/MYCDB_2024-05-31_09-52-53-AM_101724.tar needs to be copied to the standby database node and additional steps need to be run on all standby databases. Refer to the Cloud Service documentation for the complete steps.
---------- END OF PLUGIN NOTES ----------
dbaascli execution completed
Pay attention to the PLUGIN NOTES about the BLOB file to be copied on the standby site.
oracle@ExaCC-chz1-cl01n1:~/ [MYCDB1 (CDB$ROOT)] ls -ltrh /var/opt/oracle/log/reg_tmp_files/MYCDB_2024-05-31_09-52-53-AM_101724.tar
-rw------- 1 oracle oinstall 130K May 31 09:55 /var/opt/oracle/log/reg_tmp_files/MYCDB_2024-05-31_09-52-53-AM_101724.tar
Checks
Let’s check PDB on primary side:
oracle@ExaCC-chz1-cl01n1:~/ [MYCDB1 (CDB$ROOT)] sqh

SQL*Plus: Release 19.0.0.0.0 - Production on Fri May 31 09:56:30 2024
Version 19.23.0.0.0

Copyright (c) 1982, 2023, Oracle.  All rights reserved.


Connected to:
Oracle Database 19c EE Extreme Perf Release 19.0.0.0.0 - Production
Version 19.23.0.0.0

SQL> show pdbs

    CON_ID CON_NAME                       OPEN MODE  RESTRICTED
---------- ------------------------------ ---------- ----------
         2 PDB$SEED                       READ ONLY  NO
         3 PDB1                           READ WRITE NO
         4 PDB2                           READ WRITE NO
         5 PDB3                           READ WRITE NO
         6 NEWPDB                         READ WRITE NO
Let’s check PDB on standby side:
oracle@ExaCC-chz2-cl01n1:~/ [MYCDB1 (CDB$ROOT)] sqh

SQL*Plus: Release 19.0.0.0.0 - Production on Fri May 31 09:56:47 2024
Version 19.23.0.0.0

Copyright (c) 1982, 2023, Oracle.  All rights reserved.


Connected to:
Oracle Database 19c EE Extreme Perf Release 19.0.0.0.0 - Production
Version 19.23.0.0.0

SQL> show pdbs

    CON_ID CON_NAME                       OPEN MODE  RESTRICTED
---------- ------------------------------ ---------- ----------
         2 PDB$SEED                       READ ONLY  NO
         3 PDB1                           READ ONLY  NO
         4 PDB2                           READ ONLY  NO
         5 PDB3                           READ ONLY  NO
         6 NEWPDB                         MOUNTED
The PDB is not started on the standby side.
Let’s check Data Guard:
oracle@ExaCC-chz1-cl01n1:~/ [MYCDB1 (CDB$ROOT)] dgh
DGMGRL for Linux: Release 19.0.0.0.0 - Production on Fri May 31 09:57:44 2024
Version 19.23.0.0.0

Copyright (c) 1982, 2019, Oracle and/or its affiliates.  All rights reserved.

Welcome to DGMGRL, type "help" for information.

DGMGRL> connect /
Connected to "MYCDB_CHZ1"
Connected as SYSDG.

DGMGRL> show configuration lag

Configuration - fsc

  Protection Mode: MaxAvailability
  Members:
  MYCDB_CHZ1 - Primary database
    MYCDB_CHZ2 - Physical standby database
                    Transport Lag:      0 seconds (computed 0 seconds ago)
                    Apply Lag:          0 seconds (computed 0 seconds ago)

Fast-Start Failover:  Disabled

Configuration Status:
SUCCESS   (status updated 26 seconds ago)
The Data Guard between both Primary CHZ1 and Standby CHZ2 CDB is synchronized.
Try to open the PDB on standby side in READ ONLY?Let’s try to open the PDB in READ ONLY mode on the standby side.
SQL> alter pluggable database NEWPDB open read only instances=all;
alter pluggable database NEWPDB open read only instances=all
*
ERROR at line 1:
ORA-65107: Error encountered when processing the current task on instance:1
ORA-01111: name for data file 68 is unknown - rename to correct file
As we can see, this is not possible. But why?
Let’s check the size of the new PDB on the standby side.
SQL> show pdbs

    CON_ID CON_NAME                       OPEN MODE  RESTRICTED
---------- ------------------------------ ---------- ----------
         2 PDB$SEED                       READ ONLY  NO
         3 PDB1                           READ ONLY  NO
         4 PDB2                           READ ONLY  NO
         5 PDB3                           READ ONLY  NO
         6 NEWPDB                         MOUNTED

SQL> select name, total_size/1024/1024/1024 GB from v$pdbs;

NAME                                   GB
------------------------------ ----------
PDB$SEED                       1.85546875
PDB1                           2308.65039
PDB2                           1534.89966
PDB3                           1095.55273
NEWPDB                          0

SQL>
So the new PDB has been created on the standby side through Data Guard but is empty. This is why we are getting the BLOB file from dbaascli.
Copy the BLOB file to the standby sideWe will copy and make the BLOB file available on the standby side. This has been done with scp command.
[opc@ExaCC-chz2-cl01n1 ~]$ sudo mv /tmp/MYCDB_2024-05-31_09-52-53-AM_101724.tar /var/opt/oracle/log/reg_tmp_files/
[opc@ExaCC-chz2-cl01n1 ~]$ sudo chown oracle: /var/opt/oracle/log/reg_tmp_files/MYCDB_2024-05-31_09-52-53-AM_101724.tar
Create the PDB on the standby using the BLOB file
We will need now to run on the standby the same exact command we ran on the primary, adding the option --standbyBlobFromPrimary.
oracle@ExaCC-chz2-cl01n1:~/ [MYCDB1 (CDB$ROOT)] dbaascli pdb create --pdbName NEWPDB --dbName MYCDB --standbyBlobFromPrimary /var/opt/oracle/log/reg_tmp_files/MYCDB_2024-05-31_09-52-53-AM_101724.tar
DBAAS CLI version 24.1.2.0.0
Executing command pdb create --pdbName NEWPDB --dbName MYCDB --standbyBlobFromPrimary /var/opt/oracle/log/reg_tmp_files/MYCDB_2024-05-31_09-52-53-AM_101724.tar
Job id: 7c3c0a4c-d7c2-4920-b453-0aee12547af1
Session log: /var/opt/oracle/log/MYCDB/pdb/create/dbaastools_2024-05-31_10-40-26-AM_149952.log
Loading PILOT...
Session ID of the current execution is: 5623
Log file location: /var/opt/oracle/log/MYCDB/pdb/create/pilot_2024-05-31_10-40-39-AM_153628
-----------------
Running Plugin_initialization job
Enter SYS_PASSWORD:                                                                                                                                                                                                    ***********************
Enter TDE_PASSWORD:                                                                                                                                                                                                     **********************
Completed Plugin_initialization job
-----------------
Running Validate_input_params job
Completed Validate_input_params job
-----------------
Running Validate_target_pdb_service_name job
Completed Validate_target_pdb_service_name job
-----------------
Running Perform_dbca_prechecks job
Completed Perform_dbca_prechecks job
Acquiring read lock: _u02_app_oracle_product_19.0.0.0_dbhome_2
Acquiring write lock: mycdb
Acquiring write lock: newpdb
-----------------
Running PDB_creation job
Completed PDB_creation job
-----------------
Running Load_pdb_details job
Completed Load_pdb_details job
-----------------
Running Configure_pdb_service job
Completed Configure_pdb_service job
-----------------
Running Configure_tnsnames_ora job
Completed Configure_tnsnames_ora job
-----------------
Running Set_pdb_admin_user_profile job
Skipping. Job is detected as not applicable.
-----------------
Running Lock_pdb_admin_user job
Skipping. Job is detected as not applicable.
-----------------
Running Register_ocids job
Skipping. Job is detected as not applicable.
-----------------
Running Prepare_blob_for_standby_in_primary job
Skipping. Job is detected as not applicable.
Releasing lock: newpdb
Releasing lock: mycdb
Releasing lock: _u02_app_oracle_product_19.0.0.0_dbhome_2
-----------------
Running Generate_dbsystem_details job
Acquiring native write lock: global_dbsystem_details_generation
Releasing native lock: global_dbsystem_details_generation
Completed Generate_dbsystem_details job
dbaascli execution completed
Checks
Now the PDB is open in READ ONLY mode on the standby side and having data.
oracle@ExaCC-chz2-cl01n1:~/ [MYCDB1 (CDB$ROOT)] sqh

SQL*Plus: Release 19.0.0.0.0 - Production on Fri May 31 10:50:00 2024
Version 19.23.0.0.0

Copyright (c) 1982, 2023, Oracle.  All rights reserved.


Connected to:
Oracle Database 19c EE Extreme Perf Release 19.0.0.0.0 - Production
Version 19.23.0.0.0

SQL> show pdbs

    CON_ID CON_NAME                       OPEN MODE  RESTRICTED
---------- ------------------------------ ---------- ----------
         2 PDB$SEED                       READ ONLY  NO
         3 PDB1                           READ ONLY  NO
         4 PDB2                           READ ONLY  NO
         5 PDB3                           READ ONLY  NO
         6 NEWPDB                         READ ONLY  NO

SQL> select name, total_size/1024/1024/1024 GB from v$pdbs;

NAME                         GB
-------------------- ----------
PDB$SEED             1.85546875
PDB1                 2308.65039
PDB2                 1534.89966
PDB3                 1095.55273
NEWPDB               4.34375

SQL>
Let’s check Data Guard status.
DGMGRL> show configuration lag

Configuration - fsc

  Protection Mode: MaxAvailability
  Members:
  MYCDB_CHZ1 - Primary database
    MYCDB_CHZ2 - Physical standby database
                    Transport Lag:      0 seconds (computed 0 seconds ago)
                    Apply Lag:          0 seconds (computed 0 seconds ago)

Fast-Start Failover:  Disabled

Configuration Status:
SUCCESS   (status updated 55 seconds ago)
And we can that the standby is in sync with the primary.
To wrap upCreating a new PDB in a multitenant environment with Data guard need to run creation of the PDB on the standby side. This is quite easy with dbaascli.
L’article Create new PDB in a Data Guard environment on ExaCC est apparu en premier sur dbi Blog.
Issue running Dynamic Scaling on hardened system
During my Dynamic Scaling tests, you might have seen my other blog on same subject, I faced one issue where Dynamic Scaling could not be started properly due to hardened configuration. In this blog I would like to share my investigation and solution on this subject.
Read more: Issue running Dynamic Scaling on hardened system Problem descriptionI have installed Dynamic Scaling package and remote plug-in on a Red Hat VM, in the intention to be used as remote master vm for Dynamic Scaling.
[root@dynscal-vm ~]# cat /etc/redhat-release
Red Hat Enterprise Linux release 8.9 (Ootpa)

[root@dynscal-vm dynamscaling-rpm]# rpm -i dynamicscaling-2.0.2-3.el8.x86_64.rpm
warning: dynamicscaling-2.0.2-3.el8.x86_64.rpm: Header V4 RSA/SHA256 Signature, key ID c9c430a5: NOKEY

dynamicscaling-2.0.2.3 binary has been installed on /opt/dynamicscaling succesfully!

[root@dynscal-vm dynamscaling-rpm]# rpm -i dynamicscaling-plugin-1.0.1-13.el8.x86_64.rpm
warning: dynamicscaling-plugin-1.0.1-13.el8.x86_64.rpm: Header V4 RSA/SHA256 Signature, key ID c9c430a5: NOKEY

dynamicscaling-plugin-1.0.1.13 binary has been installed on /opt/dynamicscaling-plugin succesfully!
I have been installing other required package.
[root@dynscal-vm yum.repos.d]# dnf install glibc-langpack-en
And then I tried to start manually Dynamic Scaling daemon.
[root@dynscal-vm ~]# cd /opt/dynamicscaling
[root@dynscal-vm dynamicscaling]# ./dynamicscaling.bin status
[root@dynscal-vm dynamicscaling]#
Which did not work. Same can be seen when displaying the status.
[root@dynscal-vm ~]# /opt/dynamicscaling/dynamicscaling.bin status

│▒▒▒▒▒▒▒▒▒▒▒▒▒▒▒▒▒▒▒▒▒▒▒▒▒▒▒▒▒▒▒▒▒▒▒▒▒▒▒▒▒▒▒▒▒▒▒▒▒▒▒▒▒▒▒▒│
 Dynamicscaling for ExaCC & ExaCS - Version: 2.0.2-03
 Copyright (c) 2020-2024 Oracle and/or its affiliates.
----------------------------------------------------------
 Author: Ruggero Citton
 RAC Pack, Cloud Innovation and Solution Engineering Team
│▒▒▒▒▒▒▒▒▒▒▒▒▒▒▒▒▒▒▒▒▒▒▒▒▒▒▒▒▒▒▒▒▒▒▒▒▒▒▒▒▒▒▒▒▒▒▒▒▒▒▒▒▒▒▒▒│

Dynamicscaling is not running
And same problem with the remote plug-in.
[root@dynscal-vm dynamicscaling-plugin]# /opt/dynamicscaling-plugin/dynamicscaling-plugin.bin --ocicli \
> --vm-cluster-id ocid1.vmcluster.oc1.eu-zurich-1.an5h****************************************************47na \
> --ssh-user opc \
> --ociprofile DEFAULT \
> --opcsshkey ~/.oci/baloise_exacc_dbaas_automation.pem
[root@dynscal-vm dynamicscaling-plugin]# /opt/dynamicscaling-plugin/dynamicscaling-plugin.bin --ocicli \
> --vm-cluster-id ocid1.vmcluster.oc1.eu-zurich-1.an5h****************************************************47na \
> --ssh-user opc \
> --ociprofile DEFAULT \
> --opcsshkey ~/.ssh/oci_exacc_vmcluster_opc \
> --nosilent
[root@dynscal-vm dynamicscaling-plugin]#
Troubleshooting
I ran a strace.
[root@dynscal-vm dynamscaling-rpm]# strace -o Redhat_strace_DynScal_status.txt /opt/dynamicscaling/dynamicscaling.bin status
And could find following in the log file.
execve("/tmp/par-726f6f74/cache-48a43edb76f05575ffe0cb3772651416666f42b3/dynamicscaling.bin", ["/tmp/par-726f6f74/cache-48a43edb"..., "status"], 0x55edefe570f0 /* 24 vars */) = -1 EACCES (Permission denied)
This is due because the OS is hardened. There is noexec permission on /tmp. Dynamic Scaling is trying to run a file from /tmp which is forbidden.
[root@dynscal-vm ~]# findmnt -l | grep noexec | grep tmp
/tmp                            /dev/mapper/rootvg-tmp                           xfs         rw,nosuid,nodev,noexec,relatime,seclabel,attr2,inode64,logbufs=8,logbsize=32k,noquota
Solution
The solution is to setup TEMP variable to another directory : export TEMP=/var/tmp
[opc@dynscal-vm ~]$ export TEMP=/var/tmp
[opc@dynscal-vm ~]$ /opt/dynamicscaling-plugin/dynamicscaling-plugin.bin --ocicli \
> --vm-cluster-id ocid1.vmcluster.oc1.eu-zurich-1.an5h****************************************************47na \
> --ssh-user opc \
> --ociprofile DEFAULT \
> --opcsshkey ~/.ssh/oci_exacc_vmcluster_opc \
> --logpath /tmp \
> --logfile test_dynamic_scaling_plugin \
> --nosilent

│▒▒▒▒▒▒▒▒▒▒▒▒▒▒▒▒▒▒▒▒▒▒▒▒▒▒▒▒▒▒▒▒▒▒▒▒▒▒▒▒▒▒▒▒▒▒▒▒▒▒▒▒▒▒▒▒│
  Dynamicscaling remote plugin - Version: 1.0.1-13
  Copyright (c) 2021-2023 Oracle and/or its affiliates.
----------------------------------------------------------
  Author: Ruggero Citton
  RAC Pack, Cloud Innovation and Solution Engineering Team
│▒▒▒▒▒▒▒▒▒▒▒▒▒▒▒▒▒▒▒▒▒▒▒▒▒▒▒▒▒▒▒▒▒▒▒▒▒▒▒▒▒▒▒▒▒▒▒▒▒▒▒▒▒▒▒▒│

INFO: 2024-06-17 10:06:51: dynamicscaling_plugin log file at '/tmp/test_dynamic_scaling_plugin.log'
INFO: 2024-06-17 10:06:51: Getting exadata-infrastructure informations
INFO: 2024-06-17 10:06:52: Current OCPU: 18
INFO: 2024-06-17 10:06:52: Getting ExaCC 'public-ip' IPs list...
INFO: 2024-06-17 10:06:53: Checking ssh nodes connectivity...
INFO: 2024-06-17 10:06:54: Getting nodes load...
INFO: 2024-06-17 10:06:58: Getting cluster load
SUCCESS: 2024-06-17 10:06:58: Cluster max load is 30
L’article Issue running Dynamic Scaling on hardened system est apparu en premier sur dbi Blog.
Configure Dynamic Scaling as Grid HA resource
I have recently blogged about how to install and configure Dynamic Scaling as an Oracle Linux Service daemon. See my blog, https://www.dbi-services.com/blog/how-to-automatically-manage-ocpu-on-exacc-using-dynamic-scaling/
In this blog I would like to show how to configure it as an Oracle Grid HA resource. This is the way we decided to go with at customer site. This will be an installation on a 2 nodes ExaCC cluster.
Read more: Configure Dynamic Scaling as Grid HA resource RequirementsAll following steps, described in previous blog, needs to be run on both nodes:
- RPM package installation
- oci-cli installation
- OCI config file
- OCI test
- Dynamic Scaling test with check and getocpu option to ensure the installation is successful
- Log file rotation, on the same log file from both nodes
For this cluster we used following Dynamic Scaling threshold.
--interval 60
--maxthreshold 75
--minthreshold 60
--maxocpu 48
--minocpu 4
--ocpu 4
Check if no Dynamic Scaling process is existing on both nodes.
[root@ExaCC-cl01n1 ~]# ps -ef | grep -i [d]ynamic
[root@ExaCC-cl01n1 ~]#

[root@ExaCC-cl01n2 ~]# ps -ef | grep -i [d]ynamic
[root@ExaCC-cl01n2 ~]#
Check existing Grid resource related to Dynamic scaling.
[root@ExaCC-cl01n1 ~]# cd /u01/app/19.0.0.0/grid/bin/

[root@ExaCC-cl01n1 bin]# ./crsctl stat res -t | grep -i .acfsvol01.acfs
ora.datac1.acfsvol01.acfs
Check that no Dynamic Scaling resource is today existing.
[root@ExaCC-cl01n1 bin]# ./crsctl stat res -t | grep -i dynamicscaling
[root@ExaCC-cl01n1 bin]#
Create grid resource for Dynamic Scaling. vm-cluster-id and danymicscaling.srv needs to be adapted for each cluster.
[root@ExaCC-cl01n1 bin]# /u01/app/19.0.0.0/grid/bin/crsctl add resource dynamicscaling.srv \
> -type generic_application \
> -attr \
> "START_PROGRAM='/opt/dynamicscaling/dynamicscaling.bin \
> --ocicli \
> --vm-cluster-id ocid1.vmcluster.oc1.eu-zurich-1.an5he*****************************************47na \
> --ociprofile DEFAULT \
> --interval 60 \
> --maxthreshold 75 \
> --minthreshold 60 \
> --maxocpu 48 \
> --minocpu 4 \
> --ocpu 4 \
> --logpath /acfs01/dynscal_logs',
> STOP_PROGRAM='/opt/dynamicscaling/dynamicscaling.bin stop_resource',
> CLEAN_PROGRAM='/opt/dynamicscaling/dynamicscaling.bin stop_resource',
> PID_FILES='/tmp/.dynamicscaling.pid',
> START_DEPENDENCIES='hard(ora.datac1.acfsvol01.acfs)',
> STOP_DEPENDENCIES='hard(ora.datac1.acfsvol01.acfs)',
> ENVIRONMENT_VARS='PATH=$PATH:/home/opc/bin,HOME=/home/opc,HTTP_PROXY=http://webproxy.domain.com:XXXX,HTTPS_PROXY=http://webproxy.domain.com:XXXX'"
[root@ExaCC-cl01n1 bin]#
Check Dynamic Scaling resource.
[root@ExaCC-cl01n1 bin]# ./crsctl stat res -t | grep -i dynamicscaling
dynamicscaling.srv
Start Dynamic Scaling resource
Let’s start Dynamic Scaling resource.
[root@ExaCC-cl01n1 bin]# ps -ef | grep -i [d]ynamic
[root@ExaCC-cl01n1 bin]# ./crsctl start resource dynamicscaling.srv
CRS-2672: Attempting to start 'dynamicscaling.srv' on 'ExaCC-cl01n2'
CRS-2676: Start of 'dynamicscaling.srv' on 'ExaCC-cl01n2' succeeded
As per the output Dynamic Scaling has been started on node 2.
Which is correct as per the linux processes.
[root@ExaCC-cl01n1 bin]# ps -ef | grep -i [d]ynamic
[root@ExaCC-cl01n1 bin]#

[root@ExaCC-cl01n2 bin]# ps -ef | grep -i [d]ynamic
root      95918      1  0 09:53 ?        00:00:00 /opt/dynamicscaling/dynamicscaling.bin                                              --ocicli --vm-cluster-id ocid1.vmcluster.oc1.eu-zurich-1.an5he*****************************************47na --ociprofile DEFAULT --interval 60 --maxthreshold 75 --minthreshold 60 --maxocpu 48 --minocpu 4 --ocpu 4 --logpath /acfs01/dynscal_logs
[root@ExaCC-cl01n2 bin]#
Let’s stop it.
[root@ExaCC-cl01n1 bin]# ./crsctl stop resource dynamicscaling.srv
CRS-2673: Attempting to stop 'dynamicscaling.srv' on 'ExaCC-cl01n2'
CRS-2677: Stop of 'dynamicscaling.srv' on 'ExaCC-cl01n2' succeeded

[root@ExaCC-cl01n1 bin]# ./crsctl status resource dynamicscaling.srv
NAME=dynamicscaling.srv
TYPE=generic_application
TARGET=OFFLINE
STATE=OFFLINE
And restart it again.
[root@ExaCC-cl01n1 bin]# ./crsctl start resource dynamicscaling.srv
CRS-2672: Attempting to start 'dynamicscaling.srv' on 'ExaCC-cl01n2'
CRS-2676: Start of 'dynamicscaling.srv' on 'ExaCC-cl01n2' succeeded

[root@ExaCC-cl01n1 bin]# ./crsctl status resource dynamicscaling.srv
NAME=dynamicscaling.srv
TYPE=generic_application
TARGET=ONLINE
STATE=ONLINE on ExaCC-cl01n2
Resource has been started on node 2.
Relocate Grid resource for Dynamic Scaling to node 1As we can see in the log, scale down is currently in progress. This should not be a problem for relocating the Grid resource.
[root@ExaCC-cl01n1 bin]# ls -ltrh /acfs01/dynscal_logs/
total 12K
-rw-r--r-- 1 root root 7.0K Jul 26 09:56 dynamicscaling.log

[root@ExaCC-cl01n1 bin]# tail -f /acfs01/dynscal_logs/dynamicscaling.log
2024-07-26 09:56:06: Current OCPU=24
2024-07-26 09:56:08: Local host load ......: 23.9
2024-07-26 09:56:08: Current load is under/equal minimum threshold '60' for '60' secs
2024-07-26 09:56:08: Checking DB System status
2024-07-26 09:56:08: Getting lifecycle-state
2024-07-26 09:56:09: DB System status......: AVAILABLE
2024-07-26 09:56:09: Resetting consecutive DB System 'UPDATING' status count
2024-07-26 09:56:09: Requesting OCPU scale-Down by a factor of '4'
2024-07-26 09:56:09: Scaling-down the core-count...
2024-07-26 09:56:11: Scaling-down in progress, sleeping 180 secs...
Relocate has been successfully executed.
[root@ExaCC-cl01n1 bin]# ./crsctl status resource dynamicscaling.srv
NAME=dynamicscaling.srv
TYPE=generic_application
TARGET=ONLINE
STATE=ONLINE on ExaCC-cl01n2

[root@ExaCC-cl01n1 bin]# ./crsctl relocate resource dynamicscaling.srv -n ExaCC-cl01n1
CRS-2673: Attempting to stop 'dynamicscaling.srv' on 'ExaCC-cl01n2'
CRS-2677: Stop of 'dynamicscaling.srv' on 'ExaCC-cl01n2' succeeded
CRS-2672: Attempting to start 'dynamicscaling.srv' on 'ExaCC-cl01n1'
CRS-2676: Start of 'dynamicscaling.srv' on 'ExaCC-cl01n1' succeeded

[root@ExaCC-cl01n1 bin]# ./crsctl status resource dynamicscaling.srv
NAME=dynamicscaling.srv
TYPE=generic_application
TARGET=ONLINE
STATE=ONLINE on ExaCC-cl01n1
And the log is ok.
[root@ExaCC-cl01n1 bin]# tail -f /acfs01/dynscal_logs/dynamicscaling.log
2024-07-26 09:58:34: Getting lifecycle-state
2024-07-26 09:58:35: DB System status......: UPDATING
2024-07-26 09:58:35: Consecutive DB System 'UPDATING' status count is 0
2024-07-26 09:58:35: Checking current core count
2024-07-26 09:58:35: Getting cpu core count for 'ocid1.vmcluster.oc1.eu-zurich-1.an5he*****************************************47na' with oci-cli
2024-07-26 09:58:36: Running on ExaCC getting cpus enabled
2024-07-26 09:58:36: Current OCPU=24
2024-07-26 09:58:38: Local host load ......: 26.8
2024-07-26 09:58:38: CPU usage is under minthreshold
2024-07-26 09:58:38: Next measure in about 60 secs...
2024-07-26 09:59:38: Checking current core count
2024-07-26 09:59:38: Getting cpu core count for 'ocid1.vmcluster.oc1.eu-zurich-1.an5he*****************************************47na' with oci-cli
2024-07-26 09:59:39: Running on ExaCC getting cpus enabled
2024-07-26 09:59:39: Current OCPU=24
2024-07-26 09:59:41: Local host load ......: 13.1
2024-07-26 09:59:41: Current load is under/equal minimum threshold '60' for '60' secs
2024-07-26 09:59:41: Checking DB System status
2024-07-26 09:59:41: Getting lifecycle-state
2024-07-26 09:59:42: DB System status......: UPDATING
2024-07-26 09:59:42: Scaling-Down currently not possible due to DB System status 'UPDATING'
2024-07-26 09:59:42: zzzzzz
2024-07-26 09:59:42: Checking DB System status
2024-07-26 09:59:42: Getting lifecycle-state
2024-07-26 09:59:43: DB System status......: UPDATING
2024-07-26 09:59:43: Consecutive DB System 'UPDATING' status count is 1
2024-07-26 09:59:43: Checking current core count
2024-07-26 09:59:43: Getting cpu core count for 'ocid1.vmcluster.oc1.eu-zurich-1.an5he*****************************************47na' with oci-cli
2024-07-26 09:59:44: Running on ExaCC getting cpus enabled
2024-07-26 09:59:44: Current OCPU=24
2024-07-26 09:59:46: Local host load ......: 10.3
2024-07-26 09:59:46: CPU usage is under minthreshold
2024-07-26 09:59:46: Next measure in about 60 secs...
To wrap up
Dynamic Scaling as Grid Resource makes even more sense for ExaCC cluster automatic OCPU scaling.
L’article Configure Dynamic Scaling as Grid HA resource est apparu en premier sur dbi Blog.
How to automatically manage OCPU on ExaCC using Dynamic Scaling
To automatically scale down and up the OCPU on ExaCC cluster according to the CPU utilisation, we can use dynamic scaling. Dynamic scaling engine can be installed on each cluster nodes VM, from a remote machine as master or from container like doker or podman. We can also installed dynamic engine as a Grid HA resource. In this blog I will describe the installation, configuration and use of Dynamic Scaling on the VM from a single node cluster, as daemon configured as oracle linux service. In another blog I will describe how to install it as Grid HA resource.
Read more: How to automatically manage OCPU on ExaCC using Dynamic Scaling Pros/cons of each installation InstallationProsConsRemote machine as masterNo Dynamic Scaling engine is installed on the Cluster nodes VMNeed to use Dynamic Scaling remote plug-inOne Dynamic Scaling engine can only manage one clusterDocker or podman containerNo Dynamic Scaling engine is installed on the Cluster nodes VM
Several cluster can be managed from the same remote machineNeed to use Dynamic Scaling remote plug-in
Need to know docker and podman technology
Installation more complicatedEach VM ClusterEasy installation and use of
Dynamic scaling
Very limit host impactDynamic Scaling engine installed on each Cluster nodes VM
2 engine might decide for the scaling up/down, but with RAC database should not be a problemGrid HA ResourceEasy installation and use of
Dynamic scaling
Very limit host impact
Only one node decide about the scaling up/downDynamic Scaling engine installed on each Cluster nodes VM
At our customer we have decided to install Dynamic Scaling engine on each Cluster nodes VM but running through one Grid HA resource that can be easily relocated from one node to the others.
Internet access is mandatory from the Cluster nodes to get access to OCI resource.
Installation of Dynamic ScalingOur cluster nodes are running Oracle Linux 8.8.
[root@ExaCC-cl08n1 ~]# cat /etc/oracle-release
Oracle Linux Server release 8.8
The appropriate Dynamic Scaling package needs to be dowloaded from Doc ID 2719916.1, in our case, p36585874_202_Linux-x86-64.zip file.
We need to unzip it and to install the package.
[root@ExaCC-cl08n1 opc]# rpm -qa | grep -i dynam
[root@ExaCC-cl08n1 ~]# cd /home/opc/mwagner/dynscal-rpm/

[root@ExaCC-cl08n1 dynscal-rpm]# ls
p36585874_202_Linux-x86-64.zip

[root@ExaCC-cl08n1 dynscal-rpm]# unzip /home/opc/mwagner/dynscal-rpm/p36585874_202_Linux-x86-64.zip
Archive:  /home/opc/mwagner/dynscal-rpm/p36585874_202_Linux-x86-64.zip
  inflating: readme_dynamicscaling-2.0.2-3.el8.x86_64.txt
  inflating: dynamicscaling-2.0.2-3.el8.x86_64.rpm

[root@ExaCC-cl08n1 dynscal-rpm]# ls -ltrh
total 28M
-rw-rw-r-- 1 root root 14M May  6 13:57 dynamicscaling-2.0.2-3.el8.x86_64.rpm
-rw-rw-r-- 1 root root 740 May  6 14:27 readme_dynamicscaling-2.0.2-3.el8.x86_64.txt
-rw-r--r-- 1 opc  opc  14M Jul 26 08:38 p36585874_202_Linux-x86-64.zip

[root@ExaCC-cl08n1 dynscal-rpm]# rpm -i dynamicscaling-2.0.2-3.el8.x86_64.rpm
warning: dynamicscaling-2.0.2-3.el8.x86_64.rpm: Header V4 RSA/SHA256 Signature, key ID c9c430a5: NOKEY

dynamicscaling-2.0.2.3 binary has been installed on /opt/dynamicscaling succesfully!

[root@ExaCC-cl08n1 dynscal-rpm]# rpm -qa | grep -i dynam
dynamicscaling-2.0.2-3.x86_64
Install oci-cli
I have been installing oci-cli by downloading the offline installation package (oci-cli-3.43.2-Oracle-Linux-8-Offline.zip) from github project, maintained by Oracle Corp, https://github.com/oracle/oci-cli?tab=readme-ov-file.
[opc@ExaCC-cl08n1 ~]$ cd /home/opc/mwagner/dynscal-rpm/

[opc@ExaCC-cl08n1 dynscal-rpm]$ unzip -q oci-cli-3.43.2-Oracle-Linux-8-Offline.zip

[opc@ExaCC-cl08n1 dynscal-rpm]$ ls -ltrh
total 119M
-rw-rw-r-- 1 root root 14M May  6 13:57 dynamicscaling-2.0.2-3.el8.x86_64.rpm
-rw-rw-r-- 1 root root 740 May  6 14:27 readme_dynamicscaling-2.0.2-3.el8.x86_64.txt
drwxrwxr-x 3 opc  opc   58 Jun 18 23:26 oci-cli-installation
-rw-r--r-- 1 opc  opc  14M Jul 26 08:38 p36585874_202_Linux-x86-64.zip
-rw-r--r-- 1 opc  opc  92M Jul 26 08:47 oci-cli-3.43.2-Oracle-Linux-8-Offline.zip

[opc@ExaCC-cl08n1 dynscal-rpm]$ cd oci-cli-installation

[opc@ExaCC-cl08n1 oci-cli-installation]$ python --version
Python 3.6.8

[opc@ExaCC-cl08n1 oci-cli-installation]$ bash install.sh --offline-install

    ******************************************************************************
    You have started the OCI CLI Installer in interactive mode. If you do not wish
    to run this in interactive mode, please include the --accept-all-defaults option.
    If you have the script locally and would like to know more about
    input options for this script, then you can run:
    ./install.sh -h
    If you would like to know more about input options for this script, refer to:
    https://github.com/oracle/oci-cli/blob/master/scripts/install/README.rst
    ******************************************************************************
Starting OCI CLI Offline Installation
Running install script.
python3 ./install.py  --offline-install
-- Verifying Python version.
-- Python version 3.6.8 okay.

===> In what directory would you like to place the install? (leave blank to use '/home/opc/lib/oracle-cli'):
-- Creating directory '/home/opc/lib/oracle-cli'.
-- We will install at '/home/opc/lib/oracle-cli'.

===> In what directory would you like to place the 'oci' executable? (leave blank to use '/home/opc/bin'):
-- Creating directory '/home/opc/bin'.
-- The executable will be in '/home/opc/bin'.

===> In what directory would you like to place the OCI scripts? (leave blank to use '/home/opc/bin/oci-cli-scripts'):
-- Creating directory '/home/opc/bin/oci-cli-scripts'.
-- The scripts will be in '/home/opc/bin/oci-cli-scripts'.
-- Trying to use python3 venv.
-- Executing: ['/usr/bin/python3', '-m', 'venv', '/home/opc/lib/oracle-cli']
-- Executing: ['/home/opc/lib/oracle-cli/bin/pip', 'install', 'pip', '--upgrade', '--find-links', 'cli-deps/python36.html', '--no-index']
Collecting pip
Installing collected packages: pip
  Found existing installation: pip 9.0.3
    Uninstalling pip-9.0.3:
      Successfully uninstalled pip-9.0.3
Successfully installed pip-21.3.1
-- Executing: ['/home/opc/lib/oracle-cli/bin/pip', 'install', 'oci_cli', '--find-links', 'cli-deps/python36.html', '--no-index', '--ignore-requires-python']
Looking in links: cli-deps/python36.html
Processing ./cli-deps/oci_cli-3.43.2-py3-none-any.whl
Processing ./cli-deps/certifi-2024.6.2-py3-none-any.whl
Processing ./cli-deps/terminaltables-3.1.10-py2.py3-none-any.whl
Processing ./cli-deps/pyOpenSSL-23.2.0-py3-none-any.whl
Processing ./cli-deps/PyYAML-6.0.1-cp36-cp36m-manylinux_2_17_x86_64.manylinux2014_x86_64.whl
Processing ./cli-deps/oci-2.128.2-py3-none-any.whl
Processing ./cli-deps/python_dateutil-2.9.0.post0-py2.py3-none-any.whl
Processing ./cli-deps/prompt_toolkit-3.0.29-py3-none-any.whl
Processing ./cli-deps/arrow-1.2.3-py3-none-any.whl
Processing ./cli-deps/pytz-2024.1-py2.py3-none-any.whl
Processing ./cli-deps/six-1.16.0-py2.py3-none-any.whl
Processing ./cli-deps/click-8.0.4-py3-none-any.whl
Processing ./cli-deps/jmespath-0.10.0-py2.py3-none-any.whl
Processing ./cli-deps/cryptography-40.0.2-cp36-abi3-manylinux_2_28_x86_64.whl
Processing ./cli-deps/importlib_metadata-4.8.3-py3-none-any.whl
Processing ./cli-deps/circuitbreaker-1.4.0.tar.gz
  Preparing metadata (setup.py) ... done
Processing ./cli-deps/wcwidth-0.2.13-py2.py3-none-any.whl
Processing ./cli-deps/typing_extensions-4.1.1-py3-none-any.whl
Processing ./cli-deps/cffi-1.15.1-cp36-cp36m-manylinux_2_5_x86_64.manylinux1_x86_64.whl
Processing ./cli-deps/pycparser-2.21-py2.py3-none-any.whl
Processing ./cli-deps/zipp-3.6.0-py3-none-any.whl
Using legacy 'setup.py install' for circuitbreaker, since package 'wheel' is not installed.
Installing collected packages: pycparser, cffi, zipp, typing-extensions, six, cryptography, wcwidth, pytz, python-dateutil, pyOpenSSL, importlib-metadata, circuitbreaker, certifi, terminaltables, PyYAML, prompt-toolkit, oci, jmespath, click, arrow, oci-cli
    Running setup.py install for circuitbreaker ... done
Successfully installed PyYAML-6.0.1 arrow-1.2.3 certifi-2024.6.2 cffi-1.15.1 circuitbreaker-1.4.0 click-8.0.4 cryptography-40.0.2 importlib-metadata-4.8.3 jmespath-0.10.0 oci-2.128.2 oci-cli-3.43.2 prompt-toolkit-3.0.29 pyOpenSSL-23.2.0 pycparser-2.21 python-dateutil-2.9.0.post0 pytz-2024.1 six-1.16.0 terminaltables-3.1.10 typing-extensions-4.1.1 wcwidth-0.2.13 zipp-3.6.0

===> Modify profile to update your $PATH and enable shell/tab completion now? (Y/n):

===> Enter a path to an rc file to update (file will be created if it does not exist) (leave blank to use '/home/opc/.bashrc'):
-- Backed up '/home/opc/.bashrc' to '/home/opc/.bashrc.backup'
-- Tab completion set up complete.
-- If tab completion is not activated, verify that '/home/opc/.bashrc' is sourced by your shell.

-- ** Run `exec -l $SHELL` to restart your shell. **

-- Installation successful.

Announcement
============
1. Interactive mode now available in CLI
Have you tried the new interactive features in OCI CLI yet? You can get started by typing `oci -i`.
Learn more by watching our informative video on YouTube -> https://www.youtube.com/watch?v=lX29Xw1Te54&ab_channel=OracleLearning
Also see https://docs.oracle.com/iaas/Content/API/SDKDocs/cliusing_topic-Using_Interactive_Mode.htm
============

-- Run the CLI with /home/opc/bin/oci --help
Configure oci config file
Before configuring oci, I have been creating a group and user with the OCI console, and imported the key using the add api key menu. I have been using a key that is already existing. This information will then be used to create the config file.
Here is the oci config file for the current node.
[opc@ExaCC-cl08n1 ~]$ cd .oci

[opc@ExaCC-cl08n1 .oci]$ ls -lrh
total 12K
-rw------- 1 opc opc  322 Jul 31  2023 config
-rw------- 1 opc opc  450 Jul 31  2023 exacc_dbaas_automation_public.pem
-rw------- 1 opc opc 1.7K Jul 31  2023 exacc_dbaas_automation.pem

[opc@ExaCC-cl08n1 .oci]$ vi config
[opc@ExaCC-cl08n1 .oci]$ cat config
[DEFAULT]
user=ocid1.user.oc1..aaaaaaaaz*****************************z2kndq
fingerprint=fc:XX:XX:XX:XX:XX:XX:XX:XX:XX:XX:XX:XX:XX:XX:84
tenancy=ocid1.tenancy.oc1..aaaaaaaa52q*******************************wka
region=eu-zurich-1
key_file=~/.oci/exacc_dbaas_automation.pem
Test oci cli
We can list all region in order to ensure our oci cli configuration is working.
[opc@ExaCC-cl08n1 ~]$ oci iam region list --output table
/home/opc/lib/oracle-cli/lib64/python3.6/site-packages/oci/_vendor/httpsig_cffi/sign.py:10: CryptographyDeprecationWarning: Python 3.6 is no longer supported by the Python core team. Therefore, support for it is deprecated in cryptography. The next release of cryptography will remove support for Python 3.6.
  from cryptography.hazmat.backends import default_backend  # noqa: F401
+-----+-------------------+
| key | name              |
+-----+-------------------+
| AMS | eu-amsterdam-1    |
| ARN | eu-stockholm-1    |
| AUH | me-abudhabi-1     |
| BOG | sa-bogota-1       |
| BOM | ap-mumbai-1       |
| CDG | eu-paris-1        |
| CWL | uk-cardiff-1      |
| DXB | me-dubai-1        |
| FRA | eu-frankfurt-1    |
| GRU | sa-saopaulo-1     |
| HYD | ap-hyderabad-1    |
| IAD | us-ashburn-1      |
| ICN | ap-seoul-1        |
| JED | me-jeddah-1       |
| JNB | af-johannesburg-1 |
| KIX | ap-osaka-1        |
| LHR | uk-london-1       |
| LIN | eu-milan-1        |
| MAD | eu-madrid-1       |
| MEL | ap-melbourne-1    |
| MRS | eu-marseille-1    |
| MTY | mx-monterrey-1    |
| MTZ | il-jerusalem-1    |
| NRT | ap-tokyo-1        |
| ORD | us-chicago-1      |
| PHX | us-phoenix-1      |
| QRO | mx-queretaro-1    |
| SCL | sa-santiago-1     |
| SIN | ap-singapore-1    |
| SJC | us-sanjose-1      |
| SYD | ap-sydney-1       |
| VAP | sa-valparaiso-1   |
| VCP | sa-vinhedo-1      |
| XSP | ap-singapore-2    |
| YNY | ap-chuncheon-1    |
| YUL | ca-montreal-1     |
| YYZ | ca-toronto-1      |
| ZRH | eu-zurich-1       |
+-----+-------------------+
Policy
In order to use Dynamic Scaling I have been added following OCI policy to the group.
Allow group exacc_dynamic_scaling to use exadata-infrastructures IN COMPARTMENT ExaCC_DBaaS
Allow group exacc_dynamic_scaling to use vmclusters IN COMPARTMENT ExaCC_DBaaS
We can now test Dynamic Scaling with the check option and getocpu option (to get current ocpu).
Test with check option is successful:
[opc@ExaCC-cl08n1 .oci]$ /opt/dynamicscaling/dynamicscaling.bin check \
> --ocicli \
> --vm-cluster-id ocid1.vmcluster.oc1.eu-zurich-1.an5h*****************************************j3ba \
> --ociprofile DEFAULT

│▒▒▒▒▒▒▒▒▒▒▒▒▒▒▒▒▒▒▒▒▒▒▒▒▒▒▒▒▒▒▒▒▒▒▒▒▒▒▒▒▒▒▒▒▒▒▒▒▒▒▒▒▒▒▒▒│
 Dynamicscaling for ExaCC & ExaCS - Version: 2.0.2-03
 Copyright (c) 2020-2024 Oracle and/or its affiliates.
----------------------------------------------------------
 Author: Ruggero Citton
 RAC Pack, Cloud Innovation and Solution Engineering Team
│▒▒▒▒▒▒▒▒▒▒▒▒▒▒▒▒▒▒▒▒▒▒▒▒▒▒▒▒▒▒▒▒▒▒▒▒▒▒▒▒▒▒▒▒▒▒▒▒▒▒▒▒▒▒▒▒│

INFO: 2024-07-09 14:28:31: Checking OCI connectivity...
SUCCESS: 2024-07-09 14:28:32: OCI connectivity check done successfully
getocpu option is also working and giving us current OCPU to be equal to 2 OCPU, 1 VM, so 2 per VM.
[opc@ExaCC-cl08n1 .oci]$ /opt/dynamicscaling/dynamicscaling.bin getocpu \
> --ocicli \
> --vm-cluster-id ocid1.vmcluster.oc1.eu-zurich-1.an5he*****************************************j3ba \
> --ociprofile DEFAULT

│▒▒▒▒▒▒▒▒▒▒▒▒▒▒▒▒▒▒▒▒▒▒▒▒▒▒▒▒▒▒▒▒▒▒▒▒▒▒▒▒▒▒▒▒▒▒▒▒▒▒▒▒▒▒▒▒│
 Dynamicscaling for ExaCC & ExaCS - Version: 2.0.2-03
 Copyright (c) 2020-2024 Oracle and/or its affiliates.
----------------------------------------------------------
 Author: Ruggero Citton
 RAC Pack, Cloud Innovation and Solution Engineering Team
│▒▒▒▒▒▒▒▒▒▒▒▒▒▒▒▒▒▒▒▒▒▒▒▒▒▒▒▒▒▒▒▒▒▒▒▒▒▒▒▒▒▒▒▒▒▒▒▒▒▒▒▒▒▒▒▒│

INFO: 2024-07-09 14:29:54: Checking DB System status

- -------------------------------------------------------
  VM Cluster OCID        : ocid1.vmcluster.oc1.eu-zurich-1.an5h*****************************************j3ba
  OCI profile name       : DEFAULT
- -------------------------------------------------------
  DB System status       : AVAILABLE
  Current OCPU           : 2
  Current physical CPUs  : 2
- -------------------------------------------------------
  Dynamicscaling Log file: '/tmp/dynamicscaling.log'
---------------------------------------------------------
Functionning
From the DocId, we can read that “Oracle DynamicScaling can be executed as standalone executable or as daemon on one or more ExaDB-D compute nodes or ExaDB-C@C vmcluster nodes. By default DynamicScaling is monitoring the CPUs with very limited host impact and if the load goes over the Maximum CPU threshold (“–maxthreshold”) for an interval of time (“–interval”), it will automatically will scale-up the OCPU by a factor (“–ocpu”) till a maximum limit (“–maxocpu”). If the load goes under the Minimum CPU threshold (“–minthreshold”) for an interval of time (“–interval”) scale down will be executed util the minimum limit (“–minocpu”) of ocpu.”
To avoid too frequent scale up and down, Dynamic Scaling will wait for one hour after having scaled up the OCPU before scaling it down again.
Minimun 4 OCPU factor for half rack.
Mininum 2 OCPU factor for quater rack.
I have configured log file rotation.
First I have created needed log directory.
[opc@ExaCC-cl08n1 ~]$ sudo mkdir -p /acfs01/dynscal_logs/node1
[opc@ExaCC-cl08n1 ~]$ sudo chown -R opc: /acfs01/dynscal_logs
Then I have configured log file rotation as following:
[root@ExaCC-cl08n1 ~]# cd /etc/logrotate.d/

[root@ExaCC-cl08n1 logrotate.d]# ls -ltrh
total 76K
-rw-r--r-- 1 root root 145 Feb 19  2018 wtmp
-rw-r--r-- 1 root root 408 Mar  7  2019 psacct
-rw-r--r-- 1 root root 172 Mar 11  2021 iscsiuiolog
-rw-r--r-- 1 root root  88 Apr 12  2021 dnf
-rw-r--r-- 1 root root 160 Dec 16  2021 chrony
-rw-r--r-- 1 root root 155 Feb  7  2022 aide
-rw-r--r-- 1 root root  91 Apr 11  2022 bootlog
-rw-r--r-- 1 root root  67 Dec  2  2022 ipmctl
-rw-r--r-- 1 root root 130 Mar 31  2023 btmp
-rw-r--r-- 1 root root  93 Sep 21  2023 firewalld
-rw-r--r-- 1 root root 226 Oct 25  2023 syslog
-rw-r--r-- 1 root root 237 Feb 22 15:50 sssd
-rw-r--r-- 1 root root 155 Mar  7 05:29 samba
-rw-r--r-- 1 root root 125 Apr 11 07:00 nscd
-rw-r--r-- 1 root root 103 May 14 11:51 oraiosaudit
-rw-r--r-- 1 root root 103 May 14 11:51 oraasmaudit
-rw-r--r-- 1 root root 103 May 14 11:51 oraapxaudit
-rw-r--r-- 1 root root  89 May 14 12:18 asmaudit
-rw-r--r-- 1 root root 172 May 14 14:06 ora_rdbms_uniaud

[root@ExaCC-cl08n1 logrotate.d]# vi dynamicscaling

[root@ExaCC-cl08n1 logrotate.d]# cat dynamicscaling
/acfs01/dynscal_logs/node1/* {
su opc opc
daily
notifempty
missingok
sharedscripts
copytruncate
rotate 10
size 30M
compress
}
Create linux service for Dynamic Scaling
I have created a linux service to have Dynamic Scaling running automatically as a daemon.
[root@ExaCC-cl08n1 ~]# vi /etc/systemd/system/dynamicscaling.service
[root@ExaCC-cl08n1 ~]# cat /etc/systemd/system/dynamicscaling.service
[Unit]
Description=Dynamicscaling
Wants=network-online.target local-fs.target
After=network-online.target local-fs.target

[Service]
User=opc
Type=simple
Environment="HTTP_PROXY=http://webproxy.domain.com:XXXX"
Environment="HTTPS_PROXY=http://webproxy.domain.com:XXXX"
Environment="http_proxy=http://webproxy.domain.com:XXXX"
Environment="https_proxy=http://webproxy.domain.com:XXXX"
Environment="PATH=/sbin:/bin:/usr/sbin:/usr/bin:/home/opc/bin:/home/opc/.local/bin"
ExecStart=/bin/sh -c "/opt/dynamicscaling/dynamicscaling.bin --ocicli --vm-cluster-id ocid1.vmcluster.oc1.eu-zurich-1.an5he***********************************j3ba --ociprofile DEFAULT --interval 60 --maxthreshold 70 --minthreshold 40 --maxocpu 12 --minocpu 4 --ocpu 4 --logpath /acfs01/dynscal_logs/node1"

TimeoutStartSec=300
PIDFile=/tmp/.dynamicscaling.pid
Restart=on-failure
RestartSec=5s

ExecStop=/bin/kill -s SIGINT $MAINPID

[Install]
WantedBy=multi-user.target

[root@ExaCC-cl08n1 ~]# systemctl daemon-reload
[root@ExaCC-cl08n1 ~]# systemctl enable dynamicscaling.service
Created symlink /etc/systemd/system/multi-user.target.wants/dynamicscaling.service → /etc/systemd/system/dynamicscaling.service.
Linux service has been tested.
[root@ExaCC-cl08n1 ~]# ps -ef | grep -i [d]ynamic
[root@ExaCC-cl08n1 ~]# systemctl start dynamicscaling.service

[root@ExaCC-cl08n1 ~]# systemctl status dynamicscaling.service
● dynamicscaling.service - Dynamicscaling
   Loaded: loaded (/etc/systemd/system/dynamicscaling.service; enabled; vendor preset: disabled)
   Active: active (running) since Tue 2024-07-09 22:47:16 CEST; 2s ago
 Main PID: 272574 (/opt/dynamicsca)
    Tasks: 2 (limit: 319999)
   Memory: 119.6M
   CGroup: /system.slice/dynamicscaling.service
           ├─272574 /opt/dynamicscaling/dynamicscaling.bin                                            --ocicli --vm-cluster-id ocid1.vmcluster.oc1.eu-zurich-1.an5h*****************************************j3ba >
           └─272590 /home/opc/lib/oracle-cli/bin/python3 /home/opc/bin/oci db vm-cluster get --vm-cluster-id ocid1.vmcluster.oc1.eu-zurich-1.an5h*****************************************j3ba --profile DEFAULT

Jul 09 22:47:17 ExaCC-cl08n1 sh[272574]: │▒▒▒▒▒▒▒▒▒▒▒▒▒▒▒▒▒▒▒▒▒▒▒▒▒▒▒▒▒▒▒▒▒▒▒▒▒▒▒▒▒▒▒▒▒▒▒▒▒▒▒▒▒▒▒▒│
Jul 09 22:47:17 ExaCC-cl08n1 sh[272574]:  Dynamicscaling for ExaCC & ExaCS - Version: 2.0.2-03
...
...
...

[root@ExaCC-cl08n1 ~]# ps -ef | grep -i [d]ynamic
opc      272677      1  0 22:47 ?        00:00:00 /opt/dynamicscaling/dynamicscaling.bin                                            --ocicli --vm-cluster-id ocid1.vmcluster.oc1.eu-zurich-1.an5h*****************************************3ba --ociprofile DEFAULT --interval 60 --maxthreshold 70 --minthreshold 40 --maxocpu 24 --minocpu 4 --ocpu 4

[root@ExaCC-cl08n1 ~]# systemctl stop dynamicscaling.service

[root@ExaCC-cl08n1 ~]# systemctl status dynamicscaling.service
● dynamicscaling.service - Dynamicscaling
   Loaded: loaded (/etc/systemd/system/dynamicscaling.service; enabled; vendor preset: disabled)
   Active: failed (Result: exit-code) since Tue 2024-07-09 22:47:32 CEST; 2s ago
  Process: 273462 ExecStop=/bin/kill -s SIGINT $MAINPID (code=exited, status=0/SUCCESS)
  Process: 272677 ExecStart=/bin/sh -c /opt/dynamicscaling/dynamicscaling.bin --ocicli --vm-cluster-id ocid1.vmcluster.oc1.eu-zurich-1.an5h*****************************************j3ba --ociprofile DEFAULT --i>
 Main PID: 272677 (code=exited, status=1/FAILURE)

Jul 09 22:47:17 ExaCC-cl08n1 sh[272574]:  Author: Ruggero Citton
Jul 09 22:47:17 ExaCC-cl08n1 sh[272574]:  RAC Pack, Cloud Innovation and Solution Engineering Team
Jul 09 22:47:17 ExaCC-cl08n1 sh[272574]: │▒▒▒▒▒▒▒▒▒▒▒▒▒▒▒▒▒▒▒▒▒▒▒▒▒▒▒▒▒▒▒▒▒▒▒▒▒▒▒▒▒▒▒▒▒▒▒▒▒▒▒▒▒▒▒▒│
Jul 09 22:47:17 ExaCC-cl08n1 sh[272574]: INFO: 2024-07-09 22:47:17: ================================================
Jul 09 22:47:17 ExaCC-cl08n1 sh[272574]: INFO: 2024-07-09 22:47:17: Dynamicscaling version '2.0.2-03' is starting...
Jul 09 22:47:17 ExaCC-cl08n1 sh[272574]: INFO: 2024-07-09 22:47:17: ================================================
Jul 09 22:47:32 ExaCC-cl08n1 systemd[1]: Stopping Dynamicscaling...
Jul 09 22:47:32 ExaCC-cl08n1 systemd[1]: dynamicscaling.service: Main process exited, code=exited, status=1/FAILURE
Jul 09 22:47:32 ExaCC-cl08n1 systemd[1]: dynamicscaling.service: Failed with result 'exit-code'.
Jul 09 22:47:32 ExaCC-cl08n1 systemd[1]: Stopped Dynamicscaling.

[root@ExaCC-cl08n1 ~]# ps -ef | grep -i [d]ynamic
[root@ExaCC-cl08n1 ~]#
Test Dynamic Scaling scale down
The OCPU has been increased to 12 OCPU. We have only one nodes in this cluster so 12 OCP per VM.
Check current OCUP.
[opc@ExaCC-cl08n1 ~]$ /opt/dynamicscaling/dynamicscaling.bin getocpu \
> --ocicli \
> --vm-cluster-id ocid1.vmcluster.oc1.eu-zurich-1.an5h*****************************************j3ba \
> --ociprofile DEFAULT

│▒▒▒▒▒▒▒▒▒▒▒▒▒▒▒▒▒▒▒▒▒▒▒▒▒▒▒▒▒▒▒▒▒▒▒▒▒▒▒▒▒▒▒▒▒▒▒▒▒▒▒▒▒▒▒▒│
 Dynamicscaling for ExaCC & ExaCS - Version: 2.0.2-03
 Copyright (c) 2020-2024 Oracle and/or its affiliates.
----------------------------------------------------------
 Author: Ruggero Citton
 RAC Pack, Cloud Innovation and Solution Engineering Team
│▒▒▒▒▒▒▒▒▒▒▒▒▒▒▒▒▒▒▒▒▒▒▒▒▒▒▒▒▒▒▒▒▒▒▒▒▒▒▒▒▒▒▒▒▒▒▒▒▒▒▒▒▒▒▒▒│

INFO: 2024-07-09 22:54:31: Checking DB System status

- -------------------------------------------------------
  VM Cluster OCID        : ocid1.vmcluster.oc1.eu-zurich-1.an5h*****************************************j3ba
  OCI profile name       : DEFAULT
- -------------------------------------------------------
  DB System status       : AVAILABLE
  Current OCPU           : 12
  Current physical CPUs  : 12
- -------------------------------------------------------
  Dynamicscaling Log file: '/tmp/dynamicscaling.log'
---------------------------------------------------------
Let’s start Dynamic Scaling service.
[root@ExaCC-cl08n1 ~]# ps -ef | grep -i [d]ynamic
[root@ExaCC-cl08n1 ~]# systemctl start dynamicscaling.service

[root@ExaCC-cl08n1 ~]# ps -ef | grep -i [d]ynamic
opc      348304      1  0 23:07 ?        00:00:00 /opt/dynamicscaling/dynamicscaling.bin                                            --ocicli --vm-cluster-id ocid1.vmcluster.oc1.eu-zurich-1.an5he*****************************************j3ba --ociprofile DEFAULT --interval 60 --maxthreshold 70 --minthreshold 40 --maxocpu 24 --minocpu 4 --ocpu 4
Check the logs.
[opc@ExaCC-cl08n1 ~]$ tail -f /acfs01/dynscal_logs/node1dynamicscaling.log
2024-07-09 23:07:49: Getting lifecycle-state
2024-07-09 23:07:50: DB System status......: AVAILABLE
2024-07-09 23:07:50: Resetting consecutive DB System 'UPDATING' status count
2024-07-09 23:07:50: Checking current core count
2024-07-09 23:07:50: Getting cpu core count for 'ocid1.vmcluster.oc1.eu-zurich-1.an5h*****************************************j3ba' with oci-cli
2024-07-09 23:07:50: Running on ExaCC getting cpus enabled
2024-07-09 23:07:50: Current OCPU=12
2024-07-09 23:07:52: Local host load ......:  1.5
2024-07-09 23:07:52: CPU usage is under minthreshold
2024-07-09 23:07:52: Next measure in about 60 secs...
2024-07-09 23:08:52: Checking current core count
2024-07-09 23:08:52: Getting cpu core count for 'ocid1.vmcluster.oc1.eu-zurich-1.an5h*****************************************j3ba' with oci-cli
2024-07-09 23:08:53: Running on ExaCC getting cpus enabled
2024-07-09 23:08:53: Current OCPU=12
2024-07-09 23:08:55: Local host load ......:  0.9
2024-07-09 23:08:55: Current load is under/equal minimum threshold '40' for '60' secs
2024-07-09 23:08:55: Checking DB System status
2024-07-09 23:08:55: Getting lifecycle-state
2024-07-09 23:08:56: DB System status......: AVAILABLE
2024-07-09 23:08:56: Resetting consecutive DB System 'UPDATING' status count
2024-07-09 23:08:56: Requesting OCPU scale-Down by a factor of '4'
2024-07-09 23:08:56: Scaling-down the core-count...
2024-07-09 23:08:57: Scaling-down in progress, sleeping 180 secs...
2024-07-09 23:11:57: Resetting consecutive scale-up operation count
2024-07-09 23:11:57: zzzzzz
Monitoring Dynamic Scaling
Monitoring Dynamic Scaling, I could also see some scale up in the logs.
Threshold value used in that case:
2024-07-19 18:16:17: - Dynamicscaling is running as daemon with pid '395012'
2024-07-19 18:16:17: VM Cluster OCID : ocid1.vmcluster.oc1.eu-zurich-1.anXXXXXXXXXXXXXXXXXXXXXXXXXXXXXXXXXXj5gq
2024-07-19 18:16:17: OCI-Client Profile : DEFAULT
2024-07-19 18:16:17: DB System shape : ExadataCC.X9M
2024-07-19 18:16:17: Maximum OCPU Number : 48
2024-07-19 18:16:17: Minimum OCPU Number : 4
2024-07-19 18:16:17: OCPU scale factor : 4
2024-07-19 18:16:17: Incremental scale-up : DISABLE
2024-07-19 18:16:17: Measure interval : 60
2024-07-19 18:16:17: Maximum Load threshold : 75
2024-07-19 18:16:17: Minimum Load threshold : 60
2024-07-19 18:16:17: Scale-down wait time : 60 minutes
2024-07-19 18:16:17: Cluster-aware : DISABLE
2024-07-19 18:16:17: Dry-run : DISABLE
No action:
2024-07-19 18:25:41: Local host load ……: 67.8
2024-07-19 18:25:41: Current load is between minimum '60' and maximun '75' threshold, no actions taken
Scale up:
2024-07-19 18:51:28: Local host load ……: 99.4
2024-07-19 18:51:28: Current load is over/equal maximun threshold '75' for '60' secs
2024-07-19 18:51:28: Checking DB System status
2024-07-19 18:51:28: Getting lifecycle-state
2024-07-19 18:51:31: DB System status……: AVAILABLE
2024-07-19 18:51:31: Resetting consecutive DB System 'UPDATING' status count
2024-07-19 18:51:31: Requesting OCPU scale-Up by a factor of '4'
2024-07-19 18:51:31: Scaling-up the core-count
Scaling down not possible for the next 60 min following a scale-up:
2024-07-19 18:56:52: Scaling-Down currently not possible, waiting '2024-07-19 19:51:31', 60 minutes after latest scale-Up time
With Dynamic Scaling we can also set the OCPU.
Get current OCPU :
[opc@ExaCC-cl08n1 ~]$ /opt/dynamicscaling/dynamicscaling.bin getocpu --ocicli --vm-cluster-id ocid1.vmcluster.oc1.eu-zurich-1.an5he*****************************************j3ba --ociprofile DEFAULT

│▒▒▒▒▒▒▒▒▒▒▒▒▒▒▒▒▒▒▒▒▒▒▒▒▒▒▒▒▒▒▒▒▒▒▒▒▒▒▒▒▒▒▒▒▒▒▒▒▒▒▒▒▒▒▒▒│
 Dynamicscaling for ExaCC & ExaCS - Version: 2.0.2-03
 Copyright (c) 2020-2024 Oracle and/or its affiliates.
----------------------------------------------------------
 Author: Ruggero Citton
 RAC Pack, Cloud Innovation and Solution Engineering Team
│▒▒▒▒▒▒▒▒▒▒▒▒▒▒▒▒▒▒▒▒▒▒▒▒▒▒▒▒▒▒▒▒▒▒▒▒▒▒▒▒▒▒▒▒▒▒▒▒▒▒▒▒▒▒▒▒│

INFO: 2024-07-19 08:06:02: Checking DB System status

- -------------------------------------------------------
  VM Cluster OCID        : ocid1.vmcluster.oc1.eu-zurich-1.an5he*****************************************j3ba
  OCI profile name       : DEFAULT
- -------------------------------------------------------
  DB System status       : UPDATING
  Current OCPU           : 4
  Current physical CPUs  : 4
- -------------------------------------------------------
  Dynamicscaling Log file: '/tmp/dynamicscaling.log'
---------------------------------------------------------
Set OCPU to 16:
[opc@ExaCC-cl08n1 ~]$ /opt/dynamicscaling/dynamicscaling.bin setocpu --ocicli --vm-cluster-id ocid1.vmcluster.oc1.eu-zurich-1.an5he*****************************************j3ba --ociprofile DEFAULT --ocpu 16

│▒▒▒▒▒▒▒▒▒▒▒▒▒▒▒▒▒▒▒▒▒▒▒▒▒▒▒▒▒▒▒▒▒▒▒▒▒▒▒▒▒▒▒▒▒▒▒▒▒▒▒▒▒▒▒▒│
 Dynamicscaling for ExaCC & ExaCS - Version: 2.0.2-03
 Copyright (c) 2020-2024 Oracle and/or its affiliates.
----------------------------------------------------------
 Author: Ruggero Citton
 RAC Pack, Cloud Innovation and Solution Engineering Team
│▒▒▒▒▒▒▒▒▒▒▒▒▒▒▒▒▒▒▒▒▒▒▒▒▒▒▒▒▒▒▒▒▒▒▒▒▒▒▒▒▒▒▒▒▒▒▒▒▒▒▒▒▒▒▒▒│

INFO: 2024-07-19 08:05:23: dynamicscaling log file at '/tmp/dynamicscaling.log'
INFO: 2024-07-19 08:05:26: Checking DB System status
INFO: 2024-07-19 08:05:28: Current OCPU=4
SUCCESS: 2024-07-19 08:05:29: Scaling-up to OCPU=16 in progress, please wait...
Check by getting ocpu with Dynamic Scaling:
[opc@ExaCC-cl08n1 ~]$ /opt/dynamicscaling/dynamicscaling.bin getocpu --ocicli --vm-cluster-id ocid1.vmcluster.oc1.eu-zurich-1.an5he*****************************************j3ba --ociprofile DEFAULT

│▒▒▒▒▒▒▒▒▒▒▒▒▒▒▒▒▒▒▒▒▒▒▒▒▒▒▒▒▒▒▒▒▒▒▒▒▒▒▒▒▒▒▒▒▒▒▒▒▒▒▒▒▒▒▒▒│
 Dynamicscaling for ExaCC & ExaCS - Version: 2.0.2-03
 Copyright (c) 2020-2024 Oracle and/or its affiliates.
----------------------------------------------------------
 Author: Ruggero Citton
 RAC Pack, Cloud Innovation and Solution Engineering Team
│▒▒▒▒▒▒▒▒▒▒▒▒▒▒▒▒▒▒▒▒▒▒▒▒▒▒▒▒▒▒▒▒▒▒▒▒▒▒▒▒▒▒▒▒▒▒▒▒▒▒▒▒▒▒▒▒│

INFO: 2024-07-19 08:08:40: Checking DB System status

- -------------------------------------------------------
  VM Cluster OCID        : ocid1.vmcluster.oc1.eu-zurich-1.an5he*****************************************j3ba
  OCI profile name       : DEFAULT
- -------------------------------------------------------
  DB System status       : UPDATING
  Current OCPU           : 16
  Current physical CPUs  : 16
- -------------------------------------------------------
  Dynamicscaling Log file: '/tmp/dynamicscaling.log'
---------------------------------------------------------
We have now 16 OCPU.
And in the log I could already see it was immediately scaled down by Dynamic Scaling daemon. This is why, when we have Dynamic Scaling running, there is no sense to manual increase OCPU. Dynamic Scaling daemon will do it for us.
[opc@ExaCC-cl08n1 ~]$ tail -f /acfs01/dynscal_logs/node1/dynamicscaling.log                                                                                                         2024-07-19 08:08:19: Current OCPU=16
2024-07-19 08:08:21: Local host load ......:  1.1
2024-07-19 08:08:21: Current load is under/equal minimum threshold '40' for '60' secs
2024-07-19 08:08:21: Checking DB System status
2024-07-19 08:08:21: Getting lifecycle-state
2024-07-19 08:08:22: DB System status......: AVAILABLE
2024-07-19 08:08:22: Resetting consecutive DB System 'UPDATING' status count
2024-07-19 08:08:22: Requesting OCPU scale-Down by a factor of '4'
2024-07-19 08:08:22: Scaling-down the core-count...
2024-07-19 08:08:23: Scaling-down in progress, sleeping 180 secs...
Scheduling
With Dynamic Scaling we can schedule weekly or long term period. The scheduling has got the priority over the load mesure.
Let’s schedule a weekly schedule for Friday between 9am and 4pm to have 16 OCPU. This will be done with the option --scheduling "Friday:9-16:16". Of course we can not change scheduling while the daemon is running as the scheduling is part of the daemon.
Get current OCPU:
[opc@ExaCC-cl08n1 ~]$ /opt/dynamicscaling/dynamicscaling.bin getocpu --ocicli --vm-cluster-id ocid1.vmcluster.oc1.eu-zurich-1.an5he*****************************************j3ba --ociprofile DEFAULT

│▒▒▒▒▒▒▒▒▒▒▒▒▒▒▒▒▒▒▒▒▒▒▒▒▒▒▒▒▒▒▒▒▒▒▒▒▒▒▒▒▒▒▒▒▒▒▒▒▒▒▒▒▒▒▒▒│
 Dynamicscaling for ExaCC & ExaCS - Version: 2.0.2-03
 Copyright (c) 2020-2024 Oracle and/or its affiliates.
----------------------------------------------------------
 Author: Ruggero Citton
 RAC Pack, Cloud Innovation and Solution Engineering Team
│▒▒▒▒▒▒▒▒▒▒▒▒▒▒▒▒▒▒▒▒▒▒▒▒▒▒▒▒▒▒▒▒▒▒▒▒▒▒▒▒▒▒▒▒▒▒▒▒▒▒▒▒▒▒▒▒│

INFO: 2024-07-19 07:54:12: Checking DB System status

- -------------------------------------------------------
  VM Cluster OCID        : ocid1.vmcluster.oc1.eu-zurich-1.an5he*****************************************j3ba
  OCI profile name       : DEFAULT
- -------------------------------------------------------
  DB System status       : AVAILABLE
  Current OCPU           : 4
  Current physical CPUs  : 4
- -------------------------------------------------------
  Dynamicscaling Log file: '/tmp/dynamicscaling.log'
---------------------------------------------------------
We have currently 4 OCPU.
Let’s stop the daemon, change its configuration to have the scheduling option as well and start it again.
[opc@ExaCC-cl08n1 ~]$ sudo systemctl stop dynamicscaling.service
[opc@ExaCC-cl08n1 ~]$ ps -ef | grep -i [d]ynamic
[opc@ExaCC-cl08n1 ~]$

[opc@ExaCC-cl08n1 ~]$ sudo vi /etc/systemd/system/dynamicscaling.service

[opc@ExaCC-cl08n1 ~]$ sudo systemctl daemon-reload

[opc@ExaCC-cl08n1 ~]$ cat /etc/systemd/system/dynamicscaling.service
[Unit]
Description=Dynamicscaling
Wants=network-online.target local-fs.target
After=network-online.target local-fs.target

[Service]
User=opc
Type=simple
Environment="HTTP_PROXY=http://webproxy.domain.com:XXXX"
Environment="HTTPS_PROXY=http://webproxy.domain.com:XXXX"
Environment="http_proxy=http://webproxy.domain.com:XXXX"
Environment="https_proxy=http://webproxy.domain.com:XXXX"
Environment="PATH=/sbin:/bin:/usr/sbin:/usr/bin:/home/opc/bin:/home/opc/.local/bin"
ExecStart=/bin/sh -c "/opt/dynamicscaling/dynamicscaling.bin --ocicli --vm-cluster-id ocid1.vmcluster.oc1.eu-zurich-1.an5he*****************************************j3ba --ociprofile DEFAULT --interval 60 --maxthreshold 70 --minthreshold 40 --maxocpu 12 --minocpu 4 --ocpu 4 --logpath /acfs01/dynscal_logs/node1 --scheduling 'Friday:9-16:16'"

TimeoutStartSec=300
PIDFile=/tmp/.dynamicscaling.pid
Restart=on-failure
RestartSec=5s

ExecStop=/bin/kill -s SIGINT $MAINPID

[Install]
WantedBy=multi-user.target
[opc@ExaCC-cl08n1 ~]$

[opc@ExaCC-cl08n1 ~]$ ps -ef | grep -i [d]ynamic
[opc@ExaCC-cl08n1 ~]$ sudo systemctl start dynamicscaling.service
[opc@ExaCC-cl08n1 ~]$ ps -ef | grep -i [d]ynamic
opc      278950      1 26 08:30 ?        00:00:00 /opt/dynamicscaling/dynamicscaling.bin                                            --ocicli --vm-cluster-id ocid1.vmcluster.oc1.eu-zurich-1.an5he*****************************************j3ba --ociprofile DEFAULT --interval 60 --maxthreshold 70 --minthreshold 40 --maxocpu 12 --minocpu 4 --ocpu 4 --logpath /acfs01/dynscal_logs/node1 --scheduling Friday:9-16:16
[opc@ExaCC-cl08n1 ~]$
It is not already 9am, so OCPU are still configured with 4 OCPU.
[opc@ExaCC-cl08n1 ~]$ date
Fri Jul 19 08:31:36 CEST 2024

[opc@ExaCC-cl08n1 ~]$ /opt/dynamicscaling/dynamicscaling.bin getocpu --ocicli --vm-cluster-id ocid1.vmcluster.oc1.eu-zurich-1.an5he*****************************************j3ba --ociprofile DEFAULT

│▒▒▒▒▒▒▒▒▒▒▒▒▒▒▒▒▒▒▒▒▒▒▒▒▒▒▒▒▒▒▒▒▒▒▒▒▒▒▒▒▒▒▒▒▒▒▒▒▒▒▒▒▒▒▒▒│
 Dynamicscaling for ExaCC & ExaCS - Version: 2.0.2-03
 Copyright (c) 2020-2024 Oracle and/or its affiliates.
----------------------------------------------------------
 Author: Ruggero Citton
 RAC Pack, Cloud Innovation and Solution Engineering Team
│▒▒▒▒▒▒▒▒▒▒▒▒▒▒▒▒▒▒▒▒▒▒▒▒▒▒▒▒▒▒▒▒▒▒▒▒▒▒▒▒▒▒▒▒▒▒▒▒▒▒▒▒▒▒▒▒│

INFO: 2024-07-19 08:32:36: Checking DB System status

- -------------------------------------------------------
  VM Cluster OCID        : ocid1.vmcluster.oc1.eu-zurich-1.an5he*****************************************j3ba
  OCI profile name       : DEFAULT
- -------------------------------------------------------
  DB System status       : AVAILABLE
  Current OCPU           : 4
  Current physical CPUs  : 4
- -------------------------------------------------------
  Dynamicscaling Log file: '/tmp/dynamicscaling.log'
---------------------------------------------------------
In the logs, we can now see such message, if we are out of the scheduling time.
[opc@ExaCC-cl08n1 ~]$ grep -i weekly /acfs01/dynscal_logs/node1/dynamicscaling.log
2024-07-19 08:30:57: No applicable OCPU weekly scheduling found
2024-07-19 08:32:04: No applicable OCPU weekly scheduling found
2024-07-19 08:33:10: No applicable OCPU weekly scheduling found
2024-07-19 08:34:17: No applicable OCPU weekly scheduling found
2024-07-19 08:35:24: No applicable OCPU weekly scheduling found
Now we are in the scheduling, on Friday after 9am and before 5pm. And we can see that the OCPU have been increased.
[opc@ExaCC-cl08n1 ~]$ date
Fri Jul 19 09:04:29 CEST 2024

[opc@ExaCC-cl08n1 ~]$ /opt/dynamicscaling/dynamicscaling.bin getocpu --ocicli --vm-cluster-id ocid1.vmcluster.oc1.eu-zurich-1.an5he*****************************************j3ba --ociprofile DEFAULT

│▒▒▒▒▒▒▒▒▒▒▒▒▒▒▒▒▒▒▒▒▒▒▒▒▒▒▒▒▒▒▒▒▒▒▒▒▒▒▒▒▒▒▒▒▒▒▒▒▒▒▒▒▒▒▒▒│
 Dynamicscaling for ExaCC & ExaCS - Version: 2.0.2-03
 Copyright (c) 2020-2024 Oracle and/or its affiliates.
----------------------------------------------------------
 Author: Ruggero Citton
 RAC Pack, Cloud Innovation and Solution Engineering Team
│▒▒▒▒▒▒▒▒▒▒▒▒▒▒▒▒▒▒▒▒▒▒▒▒▒▒▒▒▒▒▒▒▒▒▒▒▒▒▒▒▒▒▒▒▒▒▒▒▒▒▒▒▒▒▒▒│

INFO: 2024-07-19 09:04:32: Checking DB System status

- -------------------------------------------------------
  VM Cluster OCID        : ocid1.vmcluster.oc1.eu-zurich-1.an5he*****************************************j3ba
  OCI profile name       : DEFAULT
- -------------------------------------------------------
  DB System status       : AVAILABLE
  Current OCPU           : 16
  Current physical CPUs  : 16
- -------------------------------------------------------
  Dynamicscaling Log file: '/tmp/dynamicscaling.log'
---------------------------------------------------------
And now we will find such message in the log telling us we are in the configured scheduled time.
[opc@ExaCC-cl08n1 ~]$ tail -f /acfs01/dynscal_logs/node1/dynamicscaling.log
2024-07-19 09:35:18: Current OCPU=16
2024-07-19 09:35:18: OCPU=16 is defined by scheduling
2024-07-19 09:35:20: Local host load ......:  0.5
2024-07-19 09:35:20: Current OCPU=16 is equal to scheduled OCPU, no action taken
To wrap up
Dynamic Scaling is a great tool that will help to automatically manage OCPU. We will not pay for non used OCPU and we will have enough OCPU if needed. Also we can configure specific scheduling for OCPU. Following DocId from Oracle MOS might be interesting to review for further details:
- (ODyS) Oracle Dynamic Scaling engine – Scale-up and Scale-down automation utility for OCI DB System (ExaDB-D/ExaDB-C@C) (Doc ID 2719916.1)
- (ODyS) Oracle Dynamic Scaling – Remote Plug-in (Doc ID 2770544.1)
- (ODyS) How to make Oracle Dynamic Scaling an HA cluster resource (Doc ID 2834931.1)
L’article How to automatically manage OCPU on ExaCC using Dynamic Scaling est apparu en premier sur dbi Blog.
Why relocating the PDB after ZDM Physical Online migration with noncdb to cdb conversion is a must?
I have been blogging about ZDM Physical Online migration with noncdb to cdb conversion. As you could read in my previous article, the target database name on CDB level should be the same as the source database, knowing physical online migration is using Data Guard. In our case, at customer, we wanted to group the new migrated PDBs is some CDB, and thus the CDB name was not matching any convention any more. This is why we relocated the new migrated PDB from the target CDB database used during ZDM migration to a final one. I could later realise that in any case, if we are migrating and converting from noncdb to pdb with ZDM it is better to relocate the PDB at the end. Let me explain you why.
Read more: Why relocating the PDB after ZDM Physical Online migration with noncdb to cdb conversion is a must? ZDM bug on Grid Infra resourceI made some test and migrated a source On-Premise database to the new ExaCC but just stopping after ZDM migration completed. The naming convention will be the same as the previous blog. As we can see the noncdb Source database has been successfully migrated to the new target database on the exaCC.
oracle@ExaCC-cl01n1:~/ [ONPR1 (CDB$ROOT)] sqh

SQL*Plus: Release 19.0.0.0.0 - Production on Mon Jul 29 16:45:17 2024
Version 19.22.0.0.0

Copyright (c) 1982, 2023, Oracle.  All rights reserved.


Connected to:
Oracle Database 19c EE Extreme Perf Release 19.0.0.0.0 - Production
Version 19.22.0.0.0

SQL> show pdbs

    CON_ID CON_NAME                       OPEN MODE  RESTRICTED
---------- ------------------------------ ---------- ----------
         2 PDB$SEED                       READ ONLY  NO
         3 ONPRZ_APP_001T                 READ WRITE NO

SQL> alter session set container=ONPRZ_APP_001T;

Session altered.

SQL> show pdbs

    CON_ID CON_NAME                       OPEN MODE  RESTRICTED
---------- ------------------------------ ---------- ----------
         3 ONPRZ_APP_001T                 READ WRITE NO

SQL> select status, message from pdb_plug_in_violations;

STATUS     MESSAGE
---------- ------------------------------------------------------------------------------------------------------------------------
RESOLVED   PDB needs to import keys from source.
RESOLVED   Database option RAC mismatch: PDB installed version NULL. CDB installed version 19.0.0.0.0.
RESOLVED   PDB plugged in is a non-CDB, requires noncdb_to_pdb.sql be run.
PENDING    Database option APS mismatch: PDB installed version NULL. CDB installed version 19.0.0.0.0.
PENDING    Database option CATJAVA mismatch: PDB installed version NULL. CDB installed version 19.0.0.0.0.
PENDING    Database option CONTEXT mismatch: PDB installed version NULL. CDB installed version 19.0.0.0.0.
PENDING    Database option DV mismatch: PDB installed version NULL. CDB installed version 19.0.0.0.0.
PENDING    Database option JAVAVM mismatch: PDB installed version NULL. CDB installed version 19.0.0.0.0.
PENDING    Database option OLS mismatch: PDB installed version NULL. CDB installed version 19.0.0.0.0.
PENDING    Database option ORDIM mismatch: PDB installed version NULL. CDB installed version 19.0.0.0.0.
PENDING    Database option SDO mismatch: PDB installed version NULL. CDB installed version 19.0.0.0.0.
PENDING    Database option XML mismatch: PDB installed version NULL. CDB installed version 19.0.0.0.0.
PENDING    Database option XOQ mismatch: PDB installed version NULL. CDB installed version 19.0.0.0.0.
PENDING    Tablespace SYSTEM is not encrypted. Oracle Cloud mandates all tablespaces should be encrypted.
PENDING    Tablespace SYSAUX is not encrypted. Oracle Cloud mandates all tablespaces should be encrypted.

15 rows selected.
As it was a fast test and as my target database was still on one instance I wanted to configured it to RAC again.
I setup cluster_database instance parameter back to TRUE value.
oracle@ExaCC-cl01n1:~/ [ONPR1 (CDB$ROOT)] sqh

SQL*Plus: Release 19.0.0.0.0 - Production on Mon Jul 29 17:20:27 2024
Version 19.22.0.0.0

Copyright (c) 1982, 2023, Oracle.  All rights reserved.


Connected to:
Oracle Database 19c EE Extreme Perf Release 19.0.0.0.0 - Production
Version 19.22.0.0.0

SQL> alter system set cluster_database=TRUE scope=spfile sid='*';

System altered.
I stopped my database.
oracle@ExaCC-cl01n1:~/ [ONPR1 (CDB$ROOT)] srvctl stop database -d ONPR_CHZ2
Added back the second instance.
oracle@ExaCC-cl01n1:~/ [ONPR1 (CDB$ROOT)] srvctl add instance -d ONPR_CHZ2 -i ONPR2 -node ExaCC-cl01n2
Starting the database I could face some errors.
oracle@ExaCC-cl01n1:~/ [ONPR1 (CDB$ROOT)] srvctl start database -d ONPR_CHZ2
PRCR-1079 : Failed to start resource ora.onpr_chz2.db
CRS-5017: The resource action "ora.onpr_chz2.db start" encountered the following error:
ORA-01078: failure in processing system parameters
LRM-00109: could not open parameter file '/u02/app/oracle/product/19.0.0.0/dbhome_1/dbs/initONPR2.ora'
. For details refer to "(:CLSN00107:)" in "/u01/app/grid/diag/crs/ExaCC-cl01n2/crs/trace/crsd_oraagent_oracle.trc".

CRS-2674: Start of 'ora.onpr_chz2.db' on 'ExaCC-cl01n2' failed
CRS-2632: There are no more servers to try to place resource 'ora.onpr_chz2.db' on that would satisfy its placement policy
CRS-5017: The resource action "ora.onpr_chz2.db start" encountered the following error:
ORA-01122: database file 1 failed verification check
ORA-01110: data file 1: '+DATAC5/ONPRZ_APP_001T/datafile/system.651.1175616809'
ORA-01204: file number is 14 rather than 1 - wrong file
. For details refer to "(:CLSN00107:)" in "/u01/app/grid/diag/crs/ExaCC-cl01n1/crs/trace/crsd_oraagent_oracle.trc".

CRS-2674: Start of 'ora.onpr_chz2.db' on 'ExaCC-cl01n1' failed
Why init or spfile not in the ASM? Why the CDB will look in the ZDM temporary noncdb database folder?
I have got my 2 instances, but none are running.
oracle@ExaCC-cl01n1:~/ [ONPR1 (CDB$ROOT)] srvctl status database -d ONPR_CHZ2
Instance ONPR1 is not running on node ExaCC-cl01n1
Instance ONPR2 is not running on node ExaCC-cl01n2
I checked the grid resource configuration and could realise that ZDM changed the spfile to the ZDM temporary noncdb database one.
oracle@ExaCC-cl01n1:~/ [ONPR1 (CDB$ROOT)] srvctl config database -d ONPR_CHZ2
Database unique name: ONPR_CHZ2
Database name: ONPR
Oracle home: /u02/app/oracle/product/19.0.0.0/dbhome_1
Oracle user: oracle
Spfile: /u02/app/oracle/product/19.0.0.0/dbhome_1/dbs/spfileONPRZ_APP_001T1.ora
Password file: +DATAC5/ONPR_CHZ2/PASSWORD/pwdonpr_chz2.599.1175606525
Domain: domain.com
Start options: open
Stop options: immediate
Database role: PRIMARY
Management policy: AUTOMATIC
Server pools:
Disk Groups: DATAC5
Mount point paths: /acfs01
Services:
Type: RAC
Start concurrency:
Stop concurrency:
OSDBA group: dba
OSOPER group: racoper
Database instances: ONPR1,ONPR2
Configured nodes: ExaCC-cl01n1,ExaCC-cl01n2
CSS critical: no
CPU count: 0
Memory target: 0
Maximum memory: 0
Default network number for database services:
Database is administrator managed
I checked the spfile for the target CDB in the ASM.
[grid@ExaCC-cl01n1 ~]$ asmcmd
ASMCMD> ls +DATAC5/ONPR_CHZ2/PARAMETERFILE/
spfile.621.1175607313
And updated the grid infra resource to match it.
oracle@ExaCC-cl01n1:~/ [ONPR1 (CDB$ROOT)] srvctl modify database -d ONPR_CHZ2 -spfile '+DATAC5/ONPR_CHZ2/PARAMETERFILE/spfile.621.1175607313'
oracle@ExaCC-cl01n1:~/ [ONPR1 (CDB$ROOT)] srvctl start database -d ONPR_CHZ2
oracle@ExaCC-cl01n1:~/ [ONPR1 (CDB$ROOT)] srvctl status database -d ONPR_CHZ2
Instance ONPR1 is running on node ExaCC-cl01n1
Instance ONPR2 is running on node ExaCC-cl01n2
Placement of the PDB datafiles
As we can see from the ZDM log, ZDM is doing the noncdb to pdb conversion by creating a pluggable database with the option NOCOPY.
oracle@ExaCC-cl01n1:/u02/app/oracle/zdm/zdm_ONPR_CHZ2_280/zdm/log/ [ONPR1] grep -i "CREATE PLUGGABLE DATABASE" zdm_noncdbtopdb_conversion_211779.log
CREATE PLUGGABLE DATABASE ONPRZ_APP_001T AS CLONE USING '/tmp/ONPRZ_APP_001T.xml' NOCOPY TEMPFILE REUSE
This means the PDB datafiles remains at the same position as the noncdb database was having, in our case ONPRZ_APP_001T.
So the new PDB ONPRZ_APP_001T is located in ONPR_CHZ2 CDB but having its datafiles not in one subdirectory from the CDB using the GUID from the PDB but an external folder.
Location of the PDB datafiles:
[grid@ExaCC-cl01n1 ~]$ asmcmd
ASMCMD> ls DATAC5/ONPRZ_APP_001T/
CHANGETRACKING/
DATAGUARDCONFIG/
TEMPFILE/
controlfile/
datafile/
onlinelog/
password/
ASMCMD> ls DATAC5/ONPRZ_APP_001T/datafile
APP1.646.1175616827
APP2.644.1175616827
SYSAUX.650.1175616809
SYSTEM.651.1175616809
UNDOTBS1.648.1175616825
USERS.647.1175616827
Location of the CDB and other PDB datafiles:
ASMCMD> ls DATAC5/ONPR_CHZ2
0F39DE50B35B3B53E0638A5346646D89/
1E622346BAF56871E0630E1FA10AEBC4/
1E64CA31F0169FAEE0630E1FA10A0290/
CONTROLFILE/
DATAFILE/
ONLINELOG/
PARAMETERFILE/
PASSWORD/
TEMPFILE/
ASMCMD> ls DATAC5/ONPR_CHZ2/1E64CA31F0169FAEE0630E1FA10A0290/
TEMPFILE/
ASMCMD> ls DATAC5/ONPR_CHZ2/1E622346BAF56871E0630E1FA10AEBC4/
TEMPFILE/
ASMCMD> ls DATAC5/ONPR_CHZ2/F39DE50B35B3B53E0638A5346646D89/DATAFILE/
SYSAUX.613.1175606819
SYSTEM.612.1175606819
UNDOTBS1.614.1175606819
To wrap up
In case of a ZDM Physical Online Migration using noncdb to pdb conversion I would recommend to relocate the PDB at the end of the migration.
L’article Why relocating the PDB after ZDM Physical Online migration with noncdb to cdb conversion is a must? est apparu en premier sur dbi Blog.
Dry Run with ZDM Physical Online with no Downtime for the source
I have been sharing my experience migrating On-Premises database to ExaCC using ZDM Physical Online, see my previous blog : https://www.dbi-services.com/blog/zdm-physical-online-migration-a-success-story/
In this blog I will share how you can make a Dry Run migration on your own without impacting the source On-Premises database, so without having any downtime during the migration steps. In this blog, I will just mention the steps that you need to adapt from a normal migration. All others steps will remain the same, and if not already done, a previous short downtime on the source database is to plan to configure TDE encryption, knowing a database restart is needed after changing the instance parameters. We will keep the same naming convention from previous blog, that’s to say:
- ONPR: On-Premises database to migrate
- ONPRZ_APP_001T: Final PDB Name
- ExaCC-cl01n1: ExaCC cluster node 1
- vmonpr: Host On-Premises server
- zdmhost: VM running ZDM software
Once the migration with pause after ZDM_CONFIGURE_DG_SRC phase has been completed successfully, we have our ONPR On-Premises database as primary, and the ZDM temporary database on the ExaCC with db_unique_name the final PDB Name, onprz_app_001t, as standby. Both in sync.
ZDM job status is in paused status after Data Guard has been configured:
[zdmuser@zdmhost ~]$ /u01/app/oracle/product/zdm/bin/zdmcli query job -jobid 280
zdmhost.domain.com: Audit ID: 3494
Job ID: 280
User: zdmuser
Client: zdmhost
Job Type: "MIGRATE"
Scheduled job command: "zdmcli migrate database -sourcesid ONPR -rsp /home/zdmuser/migration/zdm_ONPR_physical_online.rsp -sourcenode vmonpr -srcauth zdmauth -srcarg1 user:oracle -srcarg2 identity_file:/home/zdmuser/.ssh/id_rsa -srcarg3 sudo_location:/usr/bin/sudo -targetnode ExaCC-cl01n1 -tgtauth zdmauth -tgtarg1 user:opc -tgtarg2 identity_file:/home/zdmuser/.ssh/id_rsa -tgtarg3 sudo_location:/usr/bin/sudo -tdekeystorepasswd -tgttdekeystorepasswd -pauseafter ZDM_CONFIGURE_DG_SRC"
Scheduled job execution start time: 2024-07-29T16:01:23+02. Equivalent local time: 2024-07-29 16:01:23
Current status: PAUSED
Current Phase: "ZDM_CONFIGURE_DG_SRC"
Result file path: "/u01/app/oracle/chkbase/scheduled/job-280-2024-07-29-16:01:46.log"
Metrics file path: "/u01/app/oracle/chkbase/scheduled/job-280-2024-07-29-16:01:46.json"
Job execution start time: 2024-07-29 16:01:46
Job execution end time: 2024-07-29 16:19:54
Job execution elapsed time: 14 minutes 56 seconds
ZDM_GET_SRC_INFO ................ COMPLETED
ZDM_GET_TGT_INFO ................ COMPLETED
ZDM_PRECHECKS_SRC ............... COMPLETED
ZDM_PRECHECKS_TGT ............... COMPLETED
ZDM_SETUP_SRC ................... COMPLETED
ZDM_SETUP_TGT ................... COMPLETED
ZDM_PREUSERACTIONS .............. COMPLETED
ZDM_PREUSERACTIONS_TGT .......... COMPLETED
ZDM_VALIDATE_SRC ................ COMPLETED
ZDM_VALIDATE_TGT ................ COMPLETED
ZDM_DISCOVER_SRC ................ COMPLETED
ZDM_COPYFILES ................... COMPLETED
ZDM_PREPARE_TGT ................. COMPLETED
ZDM_SETUP_TDE_TGT ............... COMPLETED
ZDM_RESTORE_TGT ................. COMPLETED
ZDM_RECOVER_TGT ................. COMPLETED
ZDM_FINALIZE_TGT ................ COMPLETED
ZDM_CONFIGURE_DG_SRC ............ COMPLETED
ZDM_SWITCHOVER_SRC .............. PENDING
ZDM_SWITCHOVER_TGT .............. PENDING
ZDM_POST_DATABASE_OPEN_TGT ...... PENDING
ZDM_NONCDBTOPDB_PRECHECK ........ PENDING
ZDM_NONCDBTOPDB_CONVERSION ...... PENDING
ZDM_POST_MIGRATE_TGT ............ PENDING
TIMEZONE_UPGRADE_PREPARE_TGT .... PENDING
TIMEZONE_UPGRADE_TGT ............ PENDING
ZDM_POSTUSERACTIONS ............. PENDING
ZDM_POSTUSERACTIONS_TGT ......... PENDING
ZDM_CLEANUP_SRC ................. PENDING
ZDM_CLEANUP_TGT ................. PENDING

Pause After Phase: "ZDM_CONFIGURE_DG_SRC"
And we can check Data Guard is in sync:
oracle@vmonpr:/ONPR/u00/admin/etc/ [ONPR] dgmgrl /
DGMGRL for Linux: Release 19.0.0.0.0 - Production on Mon Jul 29 16:21:32 2024
Version 19.22.0.0.0

Copyright (c) 1982, 2019, Oracle and/or its affiliates.  All rights reserved.

Welcome to DGMGRL, type "help" for information.
Connected to "ONPR"
Connected as SYSDG.

DGMGRL> show configuration lag

Configuration - ZDM_onpr

  Protection Mode: MaxPerformance
  Members:
  onpr           - Primary database
    onprz_app_001t - Physical standby database
                     Transport Lag:      0 seconds (computed 0 seconds ago)
                     Apply Lag:          0 seconds (computed 0 seconds ago)

Fast-Start Failover:  Disabled

Configuration Status:
SUCCESS   (status updated 52 seconds ago)
Manual Failover to ExaCC
Now for the migration step with pause after ZDM_SWITCHOVER_TGT phase (switchover), we will not use ZDM to do the switchover but run manually a failover. We will end in a split-brain situation having 2 primary databases, which we usually do not like, but it will not be a problem here, knowing the business application does not know anything about the ExaCC database, thus will not connect to it.
oracle@ExaCC-cl01n1:~/ [ONPR1 (CDB$ROOT)] ps -ef | grep [p]mon | grep -i onprz
oracle    34780      1  0 16:18 ?        00:00:00 ora_pmon_ONPRZ_APP_001T1

oracle@ExaCC-cl01n1:~/ [ONPR1 (CDB$ROOT)] export ORACLE_SID=ONPRZ_APP_001T1

oracle@ExaCC-cl01n1:~/ [ONPRZ_APP_001T1 (CDB$ROOT)] dgh
DGMGRL for Linux: Release 19.0.0.0.0 - Production on Mon Jul 29 16:22:59 2024
Version 19.22.0.0.0

Copyright (c) 1982, 2019, Oracle and/or its affiliates.  All rights reserved.

Welcome to DGMGRL, type "help" for information.

DGMGRL> connect sys@'ExaCC-cl01-scan:1521/ONPRZ_APP_001T.domain.com'
Password:
Connected to "ONPRZ_APP_001T"
Connected as SYSDBA.

DGMGRL> show configuration lag

Configuration - ZDM_onpr

  Protection Mode: MaxPerformance
  Members:
  onpr           - Primary database
    onprz_app_001t - Physical standby database
                     Transport Lag:      0 seconds (computed 1 second ago)
                     Apply Lag:          0 seconds (computed 1 second ago)

Fast-Start Failover:  Disabled

Configuration Status:
SUCCESS   (status updated 36 seconds ago)

DGMGRL> failover to onprz_app_001t;
Performing failover NOW, please wait...
Failover succeeded, new primary is "onprz_app_001t"

DGMGRL> show configuration lag

Configuration - ZDM_onpr

  Protection Mode: MaxPerformance
  Members:
  onprz_app_001t - Primary database
    onpr           - Physical standby database (disabled)
      ORA-16661: the standby database needs to be reinstated
                     Transport Lag:      (unknown)
                     Apply Lag:          (unknown)

Fast-Start Failover:  Disabled

Configuration Status:
SUCCESS   (status updated 1 second ago)
Check ExaCC database status
If we check our ExaCC ZDM temporary database, we can see that it is opened READ/WRITE with primary role.
oracle@ExaCC-cl01n1:~/ [ONPRZ_APP_001T1 (CDB$ROOT)] sqh

SQL*Plus: Release 19.0.0.0.0 - Production on Mon Jul 29 16:24:55 2024
Version 19.22.0.0.0

Copyright (c) 1982, 2023, Oracle.  All rights reserved.


Connected to:
Oracle Database 19c EE Extreme Perf Release 19.0.0.0.0 - Production
Version 19.22.0.0.0

SQL> select instance_name from v$instance;

INSTANCE_NAME
----------------
ONPRZ_APP_001T1

SQL> select name, db_unique_name, open_mode, database_role from v$database;

NAME      DB_UNIQUE_NAME                 OPEN_MODE            DATABASE_ROLE
--------- ------------------------------ -------------------- ----------------
ONPR      ONPRZ_APP_001T                 READ WRITE           PRIMARY
Perform last steps migration
Now we can resume the job with no other pause to perform all last migration steps. The only difference here is that we will have to use the option -skip SWITCHOVER, as we performed it manually.
[zdmuser@zdmhost ~]$ /u01/app/oracle/product/zdm/bin/zdmcli resume job -jobid 280 -skip SWITCHOVER
zdmhost.domain.com: Audit ID: 3496
We can check the jobs to be successfull.
[zdmuser@zdmhost ~]$ /u01/app/oracle/product/zdm/bin/zdmcli query job -jobid 280
zdmhost.domain.com: Audit ID: 3508
Job ID: 280
User: zdmuser
Client: zdmhost
Job Type: "MIGRATE"
Scheduled job command: "zdmcli migrate database -sourcesid ONPR -rsp /home/zdmuser/migration/zdm_ONPR_physical_online.rsp -sourcenode vmonpr -srcauth zdmauth -srcarg1 user:oracle -srcarg2 identity_file:/home/zdmuser/.ssh/id_rsa -srcarg3 sudo_location:/usr/bin/sudo -targetnode ExaCC-cl01n1 -tgtauth zdmauth -tgtarg1 user:opc -tgtarg2 identity_file:/home/zdmuser/.ssh/id_rsa -tgtarg3 sudo_location:/usr/bin/sudo -tdekeystorepasswd -tgttdekeystorepasswd -pauseafter ZDM_CONFIGURE_DG_SRC"
Scheduled job execution start time: 2024-07-29T16:01:23+02. Equivalent local time: 2024-07-29 16:01:23
Current status: SUCCEEDED
Result file path: "/u01/app/oracle/chkbase/scheduled/job-280-2024-07-29-16:01:46.log"
Metrics file path: "/u01/app/oracle/chkbase/scheduled/job-280-2024-07-29-16:01:46.json"
Job execution start time: 2024-07-29 16:01:46
Job execution end time: 2024-07-29 16:41:06
Job execution elapsed time: 23 minutes 47 seconds
ZDM_GET_SRC_INFO ................ COMPLETED
ZDM_GET_TGT_INFO ................ COMPLETED
ZDM_PRECHECKS_SRC ............... COMPLETED
ZDM_PRECHECKS_TGT ............... COMPLETED
ZDM_SETUP_SRC ................... COMPLETED
ZDM_SETUP_TGT ................... COMPLETED
ZDM_PREUSERACTIONS .............. COMPLETED
ZDM_PREUSERACTIONS_TGT .......... COMPLETED
ZDM_VALIDATE_SRC ................ COMPLETED
ZDM_VALIDATE_TGT ................ COMPLETED
ZDM_DISCOVER_SRC ................ COMPLETED
ZDM_COPYFILES ................... COMPLETED
ZDM_PREPARE_TGT ................. COMPLETED
ZDM_SETUP_TDE_TGT ............... COMPLETED
ZDM_RESTORE_TGT ................. COMPLETED
ZDM_RECOVER_TGT ................. COMPLETED
ZDM_FINALIZE_TGT ................ COMPLETED
ZDM_CONFIGURE_DG_SRC ............ COMPLETED
ZDM_SWITCHOVER_SRC .............. COMPLETED
ZDM_SWITCHOVER_TGT .............. COMPLETED
ZDM_POST_DATABASE_OPEN_TGT ...... COMPLETED
ZDM_NONCDBTOPDB_PRECHECK ........ COMPLETED
ZDM_NONCDBTOPDB_CONVERSION ...... COMPLETED
ZDM_POST_MIGRATE_TGT ............ COMPLETED
TIMEZONE_UPGRADE_PREPARE_TGT .... COMPLETED
TIMEZONE_UPGRADE_TGT ............ COMPLETED
ZDM_POSTUSERACTIONS ............. COMPLETED
ZDM_POSTUSERACTIONS_TGT ......... COMPLETED
ZDM_CLEANUP_SRC ................. COMPLETED
ZDM_CLEANUP_TGT ................. COMPLETED
And our On-Premises database has been converted and migrated into the PDB in the target database on the ExaCC.
oracle@ExaCC-cl01n1:~/ [ONPR1 (CDB$ROOT)] sqh

SQL*Plus: Release 19.0.0.0.0 - Production on Mon Jul 29 16:45:17 2024
Version 19.22.0.0.0

Copyright (c) 1982, 2023, Oracle.  All rights reserved.


Connected to:
Oracle Database 19c EE Extreme Perf Release 19.0.0.0.0 - Production
Version 19.22.0.0.0

SQL> show pdbs

    CON_ID CON_NAME                       OPEN MODE  RESTRICTED
---------- ------------------------------ ---------- ----------
         2 PDB$SEED                       READ ONLY  NO
         3 ONPRZ_APP_001T                 READ WRITE NO

SQL> alter session set container=ONPRZ_APP_001T;

Session altered.

SQL> show pdbs

    CON_ID CON_NAME                       OPEN MODE  RESTRICTED
---------- ------------------------------ ---------- ----------
         3 ONPRZ_APP_001T                 READ WRITE NO

SQL> select status, message from pdb_plug_in_violations;

STATUS     MESSAGE
---------- ------------------------------------------------------------------------------------------------------------------------
RESOLVED   PDB needs to import keys from source.
RESOLVED   Database option RAC mismatch: PDB installed version NULL. CDB installed version 19.0.0.0.0.
RESOLVED   PDB plugged in is a non-CDB, requires noncdb_to_pdb.sql be run.
PENDING    Database option APS mismatch: PDB installed version NULL. CDB installed version 19.0.0.0.0.
PENDING    Database option CATJAVA mismatch: PDB installed version NULL. CDB installed version 19.0.0.0.0.
PENDING    Database option CONTEXT mismatch: PDB installed version NULL. CDB installed version 19.0.0.0.0.
PENDING    Database option DV mismatch: PDB installed version NULL. CDB installed version 19.0.0.0.0.
PENDING    Database option JAVAVM mismatch: PDB installed version NULL. CDB installed version 19.0.0.0.0.
PENDING    Database option OLS mismatch: PDB installed version NULL. CDB installed version 19.0.0.0.0.
PENDING    Database option ORDIM mismatch: PDB installed version NULL. CDB installed version 19.0.0.0.0.
PENDING    Database option SDO mismatch: PDB installed version NULL. CDB installed version 19.0.0.0.0.
PENDING    Database option XML mismatch: PDB installed version NULL. CDB installed version 19.0.0.0.0.
PENDING    Database option XOQ mismatch: PDB installed version NULL. CDB installed version 19.0.0.0.0.
PENDING    Tablespace SYSTEM is not encrypted. Oracle Cloud mandates all tablespaces should be encrypted.
PENDING    Tablespace SYSAUX is not encrypted. Oracle Cloud mandates all tablespaces should be encrypted.

15 rows selected.
Remove Data Guard on source database
We will now just have to remove the Data Guard configuration on the source On-Premises Database.
Connecting to it with the broker, we will just have to run : DGMGRL> remove configuration;
With ZDM we even have the possibility to fully perform the migration as a Dry Run test without impacting the source database.
L’article Dry Run with ZDM Physical Online with no Downtime for the source est apparu en premier sur dbi Blog.
SQL Server: how do monitor SQL Dumps?
Few weeks ago, we had a big issue by a customer and a lot SQL Dumps was created in the SQL Server log folder.
After playing fireman at the customer’s premises, we decided to set up a monitoring system for the creation of SQL dumps.
The first step, is how to test it?In the latest version of SQL Server the 2019 & the 2022, you can run the command:
DBCC STACKDUMP
This command will generate the 3 dump files (SQLDumpxxxx.log, SQLDumpxxxx.mdmp & SQLDumpxxxx.txt) with the full memory dump in the Default Log directory. I just do it on my test VM under SQL server 2022:
For the previous version of SQL Server (and also the last one) , you have the possibility to use Sqldumper.exe in the Shared folder:
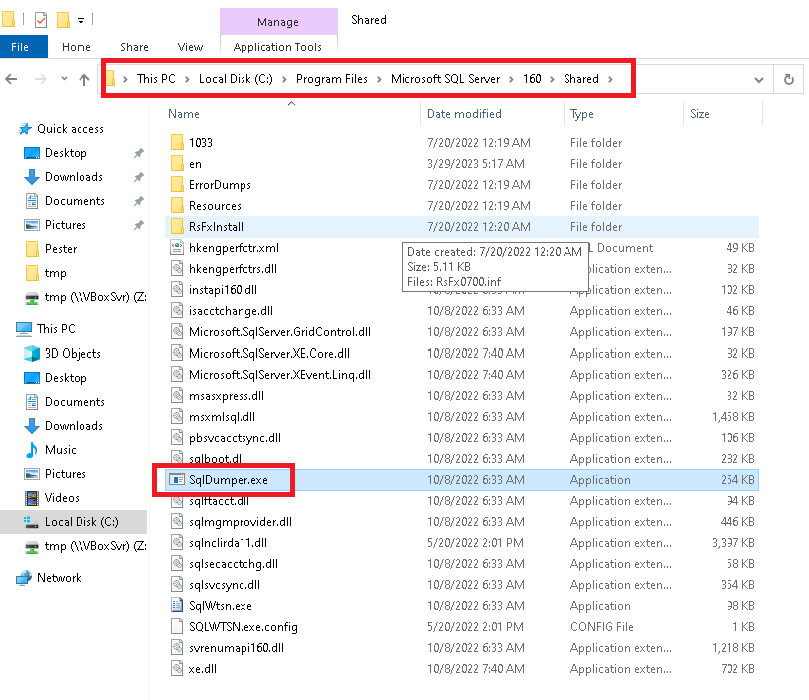
You can find more information here
Now, how to see with a T-SQL Command when a SQL Dump is generated?The easy way is to use the dynamic management view (DMV): sys.dm_server_memory_dumps
This view will return one row for each memory dump (I run 3 times DBCC STACKDUMP to have more then 1 line):
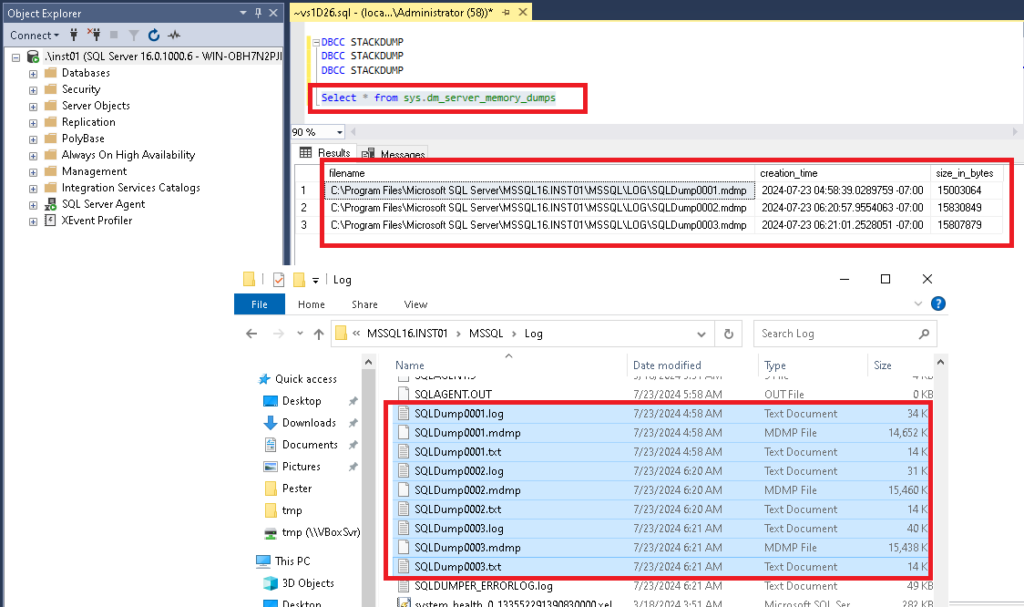
My goal is to check one time in the day if some dumps are generated.
How can I check if some dumps are generated the last day?From this DMV, I will pick the date of the last file generated and compare it to now:
DECLARE @Last_Dump_File DATETIME2;
SET @Last_Dump_File = NULL;

SELECT  TOP 1 @Last_Dump_File=creation_time FROM sys.dm_server_memory_dumps WITH (NOLOCK) ORDER BY creation_time DESC OPTION (RECOMPILE);

SELECT @Last_Dump_File

IF (@Last_Dump_File > GETDATE()-1)
BEGIN
                Select * from sys.dm_server_memory_dumps
END
A little illustration:
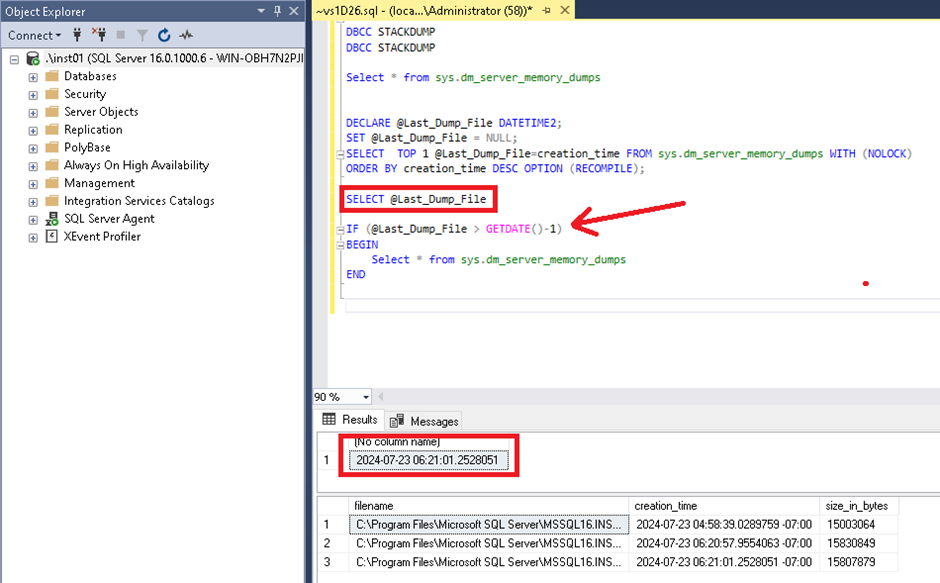 How to monitor and have an alert?
To finish, I create a job with a step with this query and sending a email to our Service Desk in case of dumps coming by our customer the last day.
Example of email:
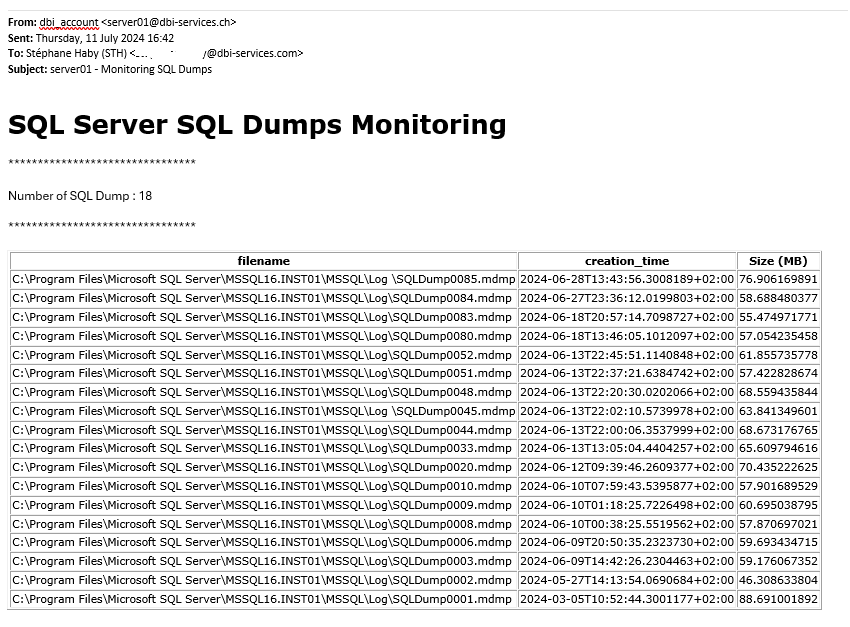
It is also the opportunity to tell you that this monitoring/alerting is included now in our DMK Maintenance, our tool to help the management of the SQL Server environment.
Don’t hesitate to come back to us for more information
L’article SQL Server: how do monitor SQL Dumps? est apparu en premier sur dbi Blog.
Creating Intuitive Cmdlets in PowerShell a Conference by Raymund Andrée
Following my precedents blogs on PSConfEU, I attended a session concerning how we can handle. This session was presented by Raimund Andrée and, besides confirming my conviction about importance in Naming Convention and indentation quality Raimund Andrée is a very good speaker and a passionate developer who likes to share his experience and here are what I learned from his presentation.
Understanding Good Programming Practices
The speaker began by emphasizing the three high-level goals of good programming:
- Solve a Specific Problem: Focus on solving one specific problem with your cmdlet. Avoid combining multiple unrelated functions into one script.
- Easy to Read: Code should be easy to read and understand. This involves following a consistent code style and minimizing code duplication.
- Easy to Maintain: Modularize your code. Functions should be concise, and large scripts should be broken down into smaller, manageable modules.
Importance of Code Style and Modularization
Having a consistent code style is crucial for collaboration. It ensures that code written by different team members is easy to read and maintain. Modularizing code not only makes it easier to understand but also aids in debugging and testing.
Best Practices for PowerShell Cmdlets
Several best practices for writing PowerShell scripts were outlined:
- Portability: Scripts should work across different environments, not just in a specific test environment.
- Modularity: Break down scripts into smaller functions to enhance reusability and readability.
- Scalability: Ensure your scripts can handle large datasets efficiently.
- Reusability: Write functions that can be reused in different projects.
- Contextual Data: Return rich data structures to provide context, not just simple strings.
Tools and Patterns
The evolution of the PowerShell ecosystem was highlighted, from the early days of simple scripting to the comprehensive suite of tools available today. Understanding and utilizing these tools and patterns is key to writing better scripts.
Parameter Handling and Validation
Effective parameter handling is crucial for creating flexible and robust cmdlets:
- Avoid Hardcoded Values: Use parameters or configuration files instead of hardcoding values.
- Parameter Validation: Use type definitions and validation attributes to ensure the input parameters are valid.
- Support for Arrays and Wildcards: Make your scripts user-friendly by supporting array inputs and wildcards.
Creating Custom Objects
One of the key patterns discussed was the use of PS custom objects. These allow you to return rich, structured data from your functions, making them more versatile and easier to work with.
Pipeline Support
The importance of designing cmdlets with pipeline support from the beginning was stressed. This involves using the begin, process, and end blocks and marking parameters to accept values from the pipeline.
Conclusion
The session was an insightful dive into the best practices and advanced techniques for creating intuitive and robust PowerShell cmdlets. By following these guidelines, we can write scripts that are not only functional but also user-friendly and maintainable.
L’article Creating Intuitive Cmdlets in PowerShell a Conference by Raymund Andrée est apparu en premier sur dbi Blog.
M-Files & Microsoft Office 365: multi-select list property in Word
One must admit that M-Files Microsoft Office 365 integration is just awesome. It allows you to interact with your beloved Knowledge Workers content services Platform through Microsoft Office 365 products. Judge by yourself M-Files ribbon in Microsoft Office Word:

At least, If you are quite familiar with these functions, you may have already worked with “Insert Property” option in order to automate filing a Word document (set as standard or template in M-Files) with related M-Files metadata properties.
PrincipleBasically, fill automatically text fields or cells in one template with the selected properties when a user creates a new document.
Very simple example illustration: create a Word file template listing document, add a title using M-Files metadata “Name or title” corresponding property
- Click on “Insert Property” button
- M-Files “Insert M-Files Property” dialog opens
- Double-click on “Name or title” property to add corresponding “Current Value” to Word document right where you placed your cursor
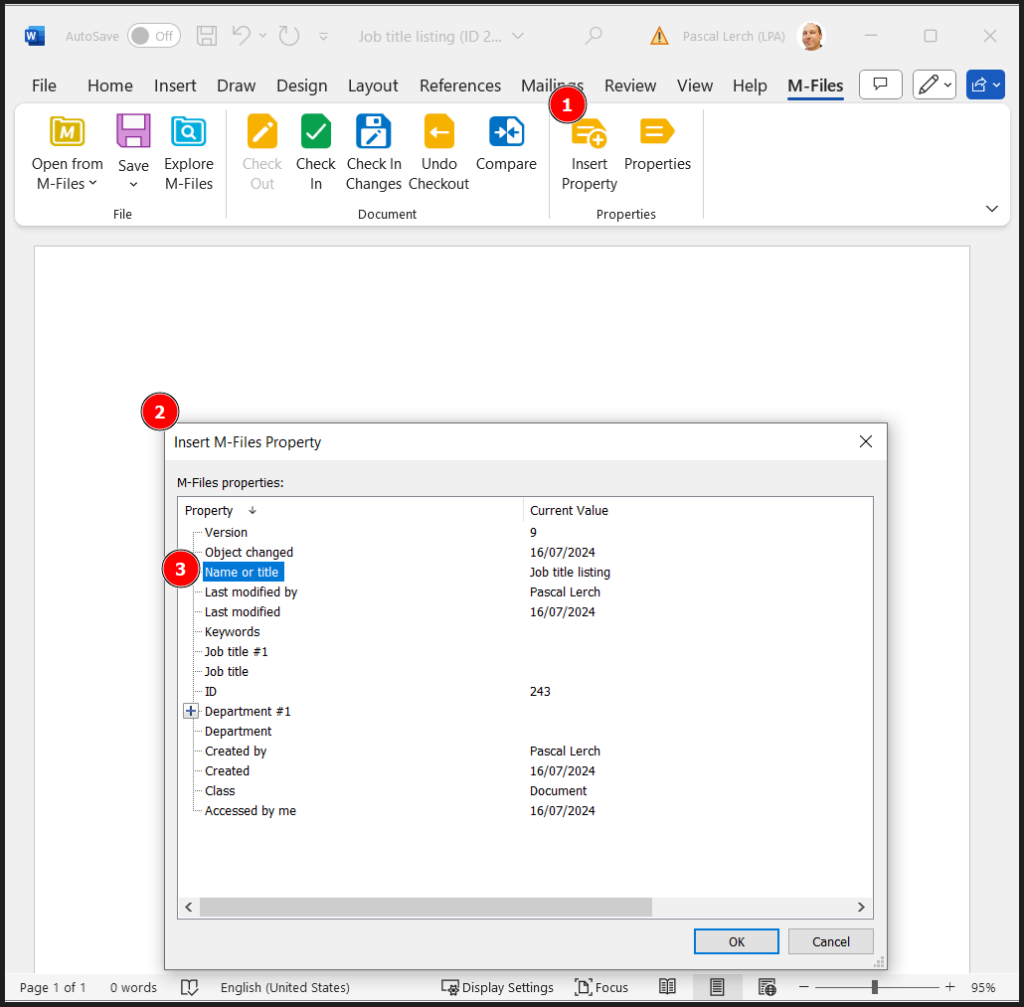
Easy and very helpful.
Until there, no such a big deal, you may think. In a sense, I concur.
From time to time, you may have to deal with one particular M-Files metadata property data type i.e “Choose from list (multi-select)“, such as in below “Job title” example.
Insert this kind of property inside your Word document template, just like any others.
Now, suppose linking your Word document template object to a Workflow (main M-Files Knowledge Workers Business admin core activity, isn’t it ?). Consider you need to populate several fields with multi-select list values. Furthermore those values are empty during the very first state.
Contextualizing* One simple Word document (Job title listing) flagged as “Is template” via M-Files property
* One M-Files metadata property (job title) set as multi-select data list among potentially others
1st difficulty that arises you may think about is the number of element management in the list. Since end user is free to add 1 to N elements available from the predefined list, it will be hard to anticipate it and set it accordingly unless your Workflow and Business case specifications lead you to control it through the different states.
In other words, either you control in advance the whole element list values you’d like to add in your target Microsoft Office 365 document or you will have to compose with the expected needs to insert these fields accordingly (probably by developing or scripting a bit) to achieve your goal without producing a document with missing or blank field values. I will leave this to reader expertise.
 Back to Word template document structure
Let’s assume we have only 2 job titles values in our list.
Remember, in our case, “job title” list isn’t filled in yet and left blank.
Fire, check out, open my Word file template and insert both fields:
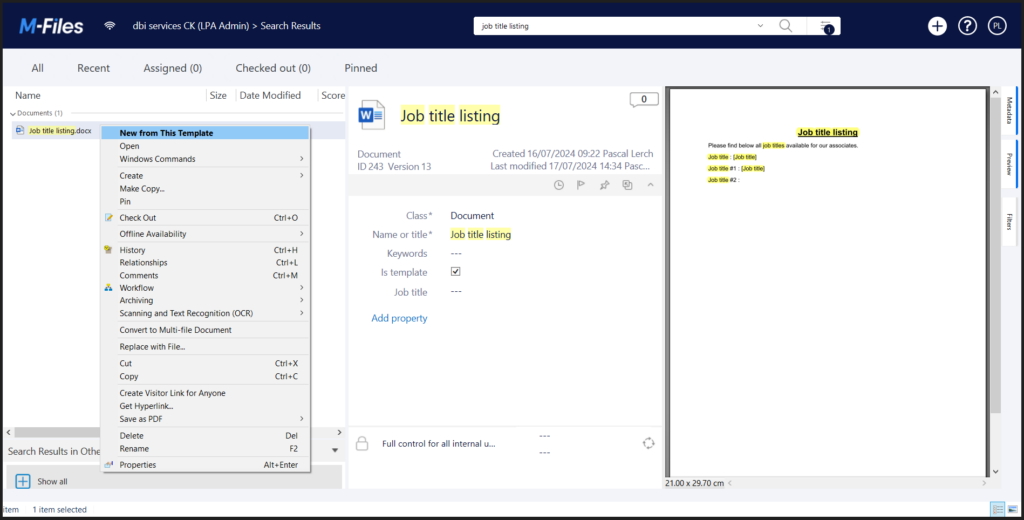

Hum … looks like something is not fully accessible:
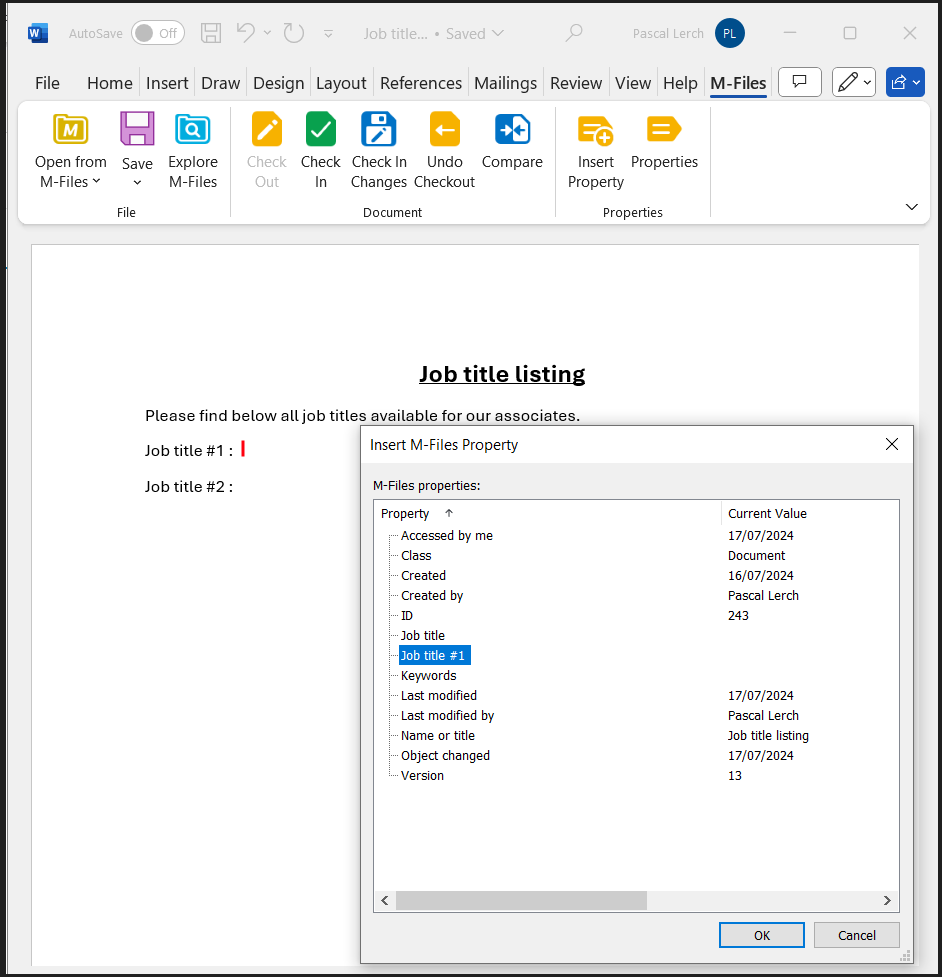
See, only insert “Job title” and “Job title #1” list value seems to be available!
Anyway, let’s add them both, save our template document and check in it back to M-Files control:
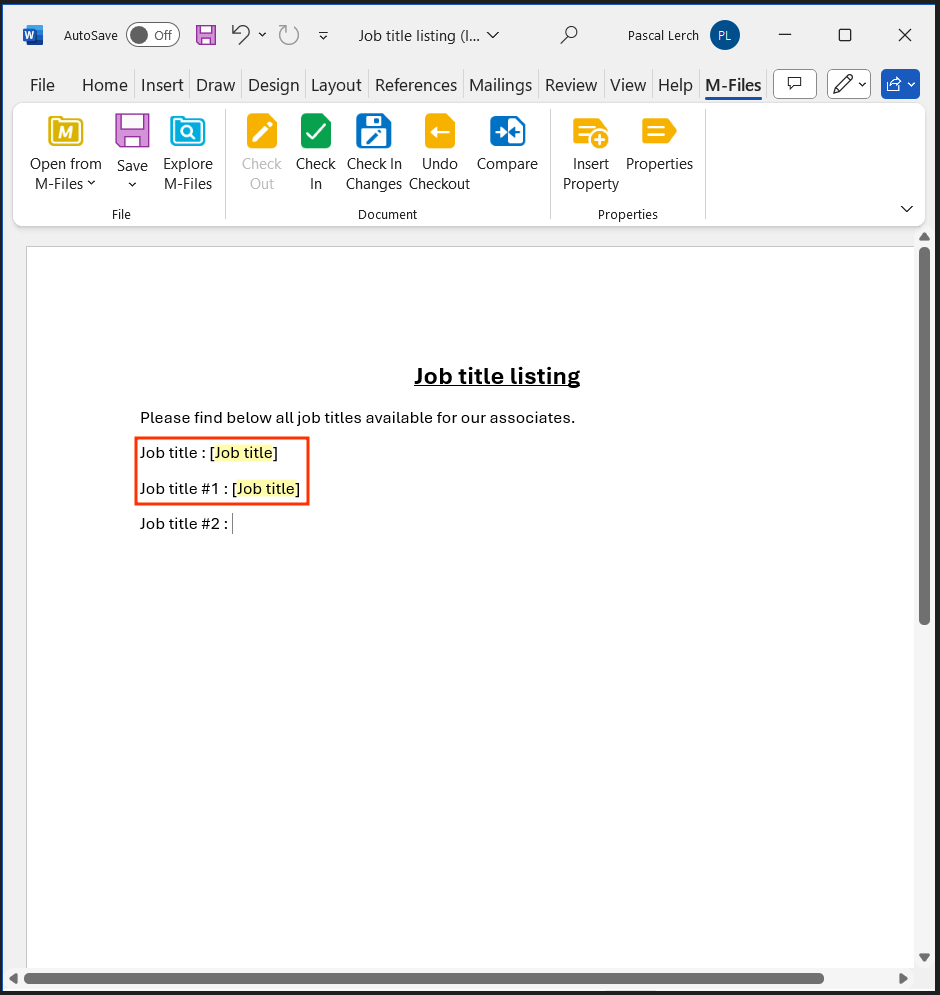
To test and look at the content, I created a new document based on this template and selected 2 values from “Job title” list:
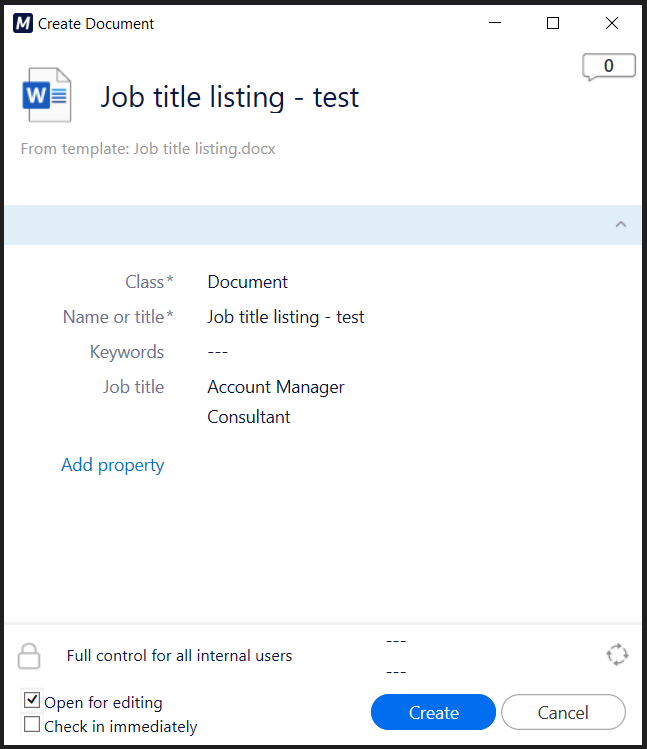
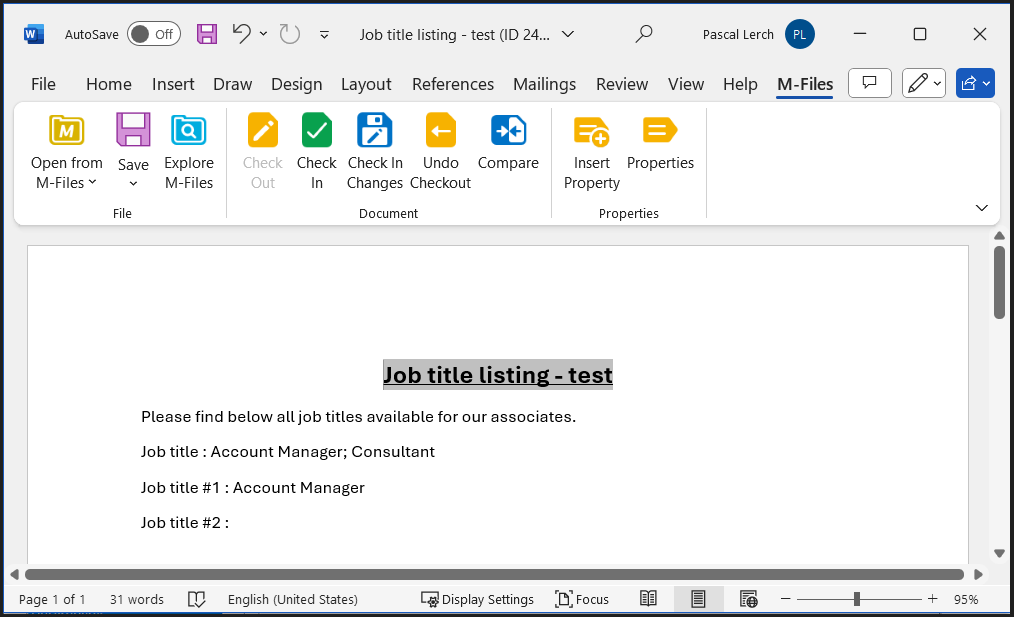
So, I guess you get the point. We have “Job title” M-Files property which is a kind of CSV with semicolon containing all list values set on M-Files metadata card’s document. Then “Job title #1” corresponding to the first value set at first position on “Job title” list property.
OK, but what’s about interacting with other list values, then ?
First of all, this behavior should not confuse you . This is the way it is and is not really a bug. In order to retrieve the second “Consultant” value, let’s edit the field in Word to better understand its construction.
Check out Word template file, place your cursor into the first M-Files property field inserted corresponding to “Job title #1” and right click to pop-up “Toggle Fields Codes” option:
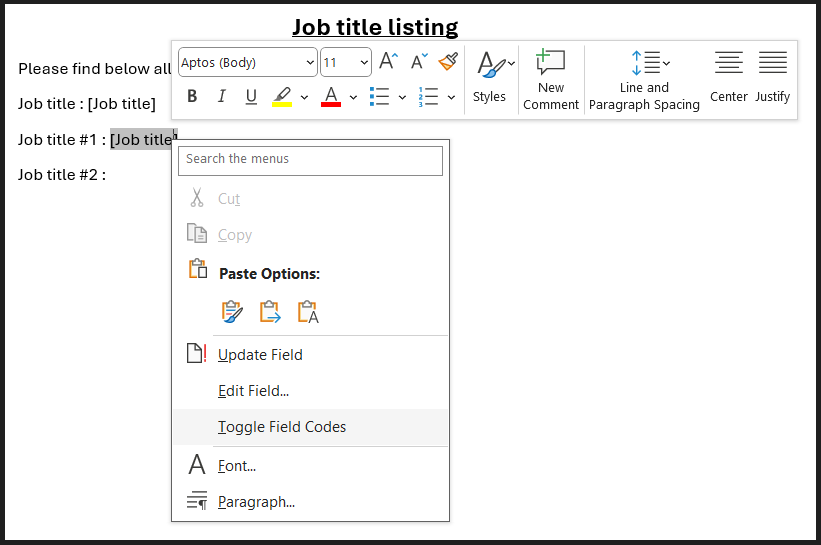

Here we are with this wonderful string “MFiles_PG12B4EA3AD6924B1BA8C780532C5E43BAn1“. If you are quite familiar with M-Files, you shall identify 12B4EA3AD6924B1BA8C780532C5E43BA as the unique ID registered for “Job title” property:
And finally guess that n1 at the end corresponds to value list position set. I’m pretty sure, now, you know how to handle it.
Check out Word template document, duplicate this field and increment n1 to n2, save and check in it:

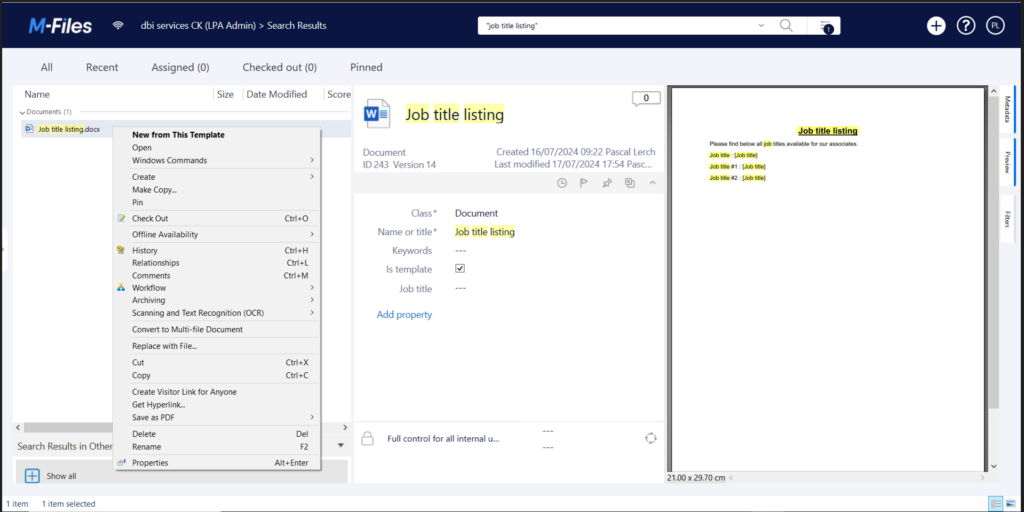
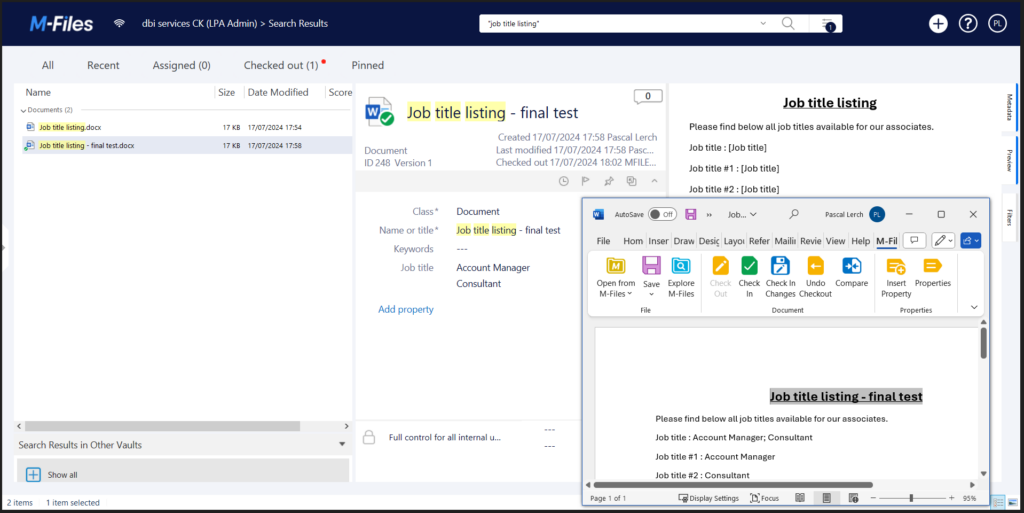
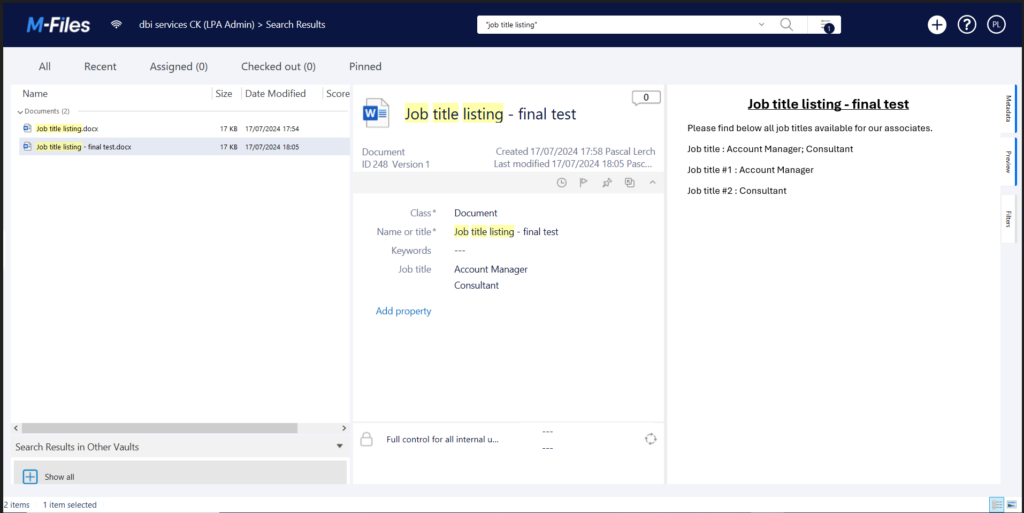
Voilà !
Hoping it shall help you and save a bit of your time while trying to achieve Office 365 – Word template writing – interacting with M-Files property list.
Feel free to contact us for any support on our Enterprise Content Management solutions.
L’article M-Files & Microsoft Office 365: multi-select list property in Word est apparu en premier sur dbi Blog.
Integrating MongoDB Documents in Oracle Database: A Modern Approach to Hybrid Data Management
In today’s data-driven world, organizations often leverage a variety of databases to meet their diverse data storage and processing needs. MongoDB and Oracle Database are two prominent names in the database landscape, each excelling in different areas. MongoDB is renowned for its flexibility and scalability in handling unstructured data, while Oracle Database is a powerhouse for structured data with robust transactional capabilities.
Integrating MongoDB documents within an Oracle database allows organizations to harness the strengths of both systems. This hybrid approach enables seamless data management, providing the flexibility of NoSQL with the reliability and performance of a traditional RDBMS. In this blog, we will explore eth technical steps involved in integrating MongoDB documents into an Oracle database.
Why Integrate MongoDB Documents in Oracle Database ?In short, is for getting the best of two worlds.
1. Unified Data View: Combining MongoDB’s unstructured data with Oracle’s structured data creates a unified view, making it easier to perform comprehensive data analysis and reporting.
2. Enhanced Flexibility: MongoDB’s schema-less architecture allows for rapid development and iteration, while Oracle’s structured schema ensures data integrity and consistency.
3. Scalability and Performance: MongoDB’s horizontal scalability complements Oracle’s vertical scaling capabilities, providing a balanced approach to handling large volumes of data.
4. Cost Efficiency: By leveraging both databases, organizations can optimize costs by storing data where it is most efficient based on its nature and usage patterns.
Technical steps to connect the two worlds. The VM preparationI made some changes to the configuration to make the database changes persistent.
For this example I use an Oracle 23 AI docker container. How to use it is explained here: https://www.oracle.com/my/database/free/get-started/
The VM used is an Oracle Linux Server VM deployed on OCI:
[opc@db23ai ~]$ cat /etc/os-release
NAME="Oracle Linux Server"
VERSION="9.4"
The docker part installation is described here: https://docs.docker.com/engine/install/rhel/
[root@db23ai ~]# yum install docker-ce docker-ce-cli containerd.io docker-buildx-plugin docker-compose-plugin
Next,I create the oracle user and groups with the same ID’s as used in the container:
[root@db23ai ~]# groupadd -g 54321 oinstall
[root@db23ai ~]# groupadd -g 54322 dba
[root@db23ai ~]# groupadd -g 54323 oper
[root@db23ai ~]# useradd -g oinstall -G dba,oper,docker --uid 54321 -m oracle
Finally I install the sqlplus client and mongo shell:
[root@db23ai u02]# dnf install oracle-instantclient-sqlplus.x86_64
[root@db23ai u02]# wget https://downloads.mongodb.com/compass/mongodb-mongosh-2.2.12.x86_64.rpm
[root@db23ai u02]# rpm -ivh mongodb-mongosh-2.2.12.x86_64.rpm
warning: mongodb-mongosh-2.2.12.x86_64.rpm: Header V4 RSA/SHA256 Signature, key ID d361cb16: NOKEY
Verifying...                          ################################# [100%]
Preparing...                          ################################# [100%]
Updating / installing...
   1:mongodb-mongosh-2.2.12-1.el8     ################################# [100%]
...
The port 1700 is for database sqlplus connections and the port 27017 is for mongosh connections. I exported some volumes first to make the Oracle database persistent, and to have a place to install ORDS (https://www.oracle.com/ch-de/database/technologies/appdev/rest.html)
Get the container:
[root@db23ai ~]# sudo su - oracle
[oracle@db23ai ~]$ docker pull container-registry.oracle.com/database/free:latest
Run the container:
[oracle@db23ai ~]$ mkdir /u02/data/DB
[oracle@db23ai ~]$ mkdir /u02/reco/DB
[oracle@db23ai ~]$ mkdir /u02/ords

[oracle@db23ai ~]$ docker run  -it --name 23ai -p 1700:1521 -p 27017:27017 \
-v /u02/data/DB:/opt/oracle/oradata \
-v /u02/reco/DB:/opt/oracle/reco \
-v /u02/oracle/ords:/opt/oracle/ords \
-e ENABLE_ARCHIVELOG=true  \
-e ORACLE_PWD="Hello-World-123" \
container-registry.oracle.com/database/free
...

# Once the traces shows that database is running we can start it as daemon (-d option)

# Test the connection to the PDB
[oracle@db23ai ~]$ sqlplus system/"Hello-World-123"@localhost:1700/freepdb1

SQL*Plus: Release 23.0.0.0.0 - Production on Thu Jul 11 12:09:40 2024
Version 23.4.0.24.05

Copyright (c) 1982, 2024, Oracle.  All rights reserved.

Last Successful login time: Thu Jul 11 2024 11:59:21 +00:00

Connected to:
Oracle Database 23ai Free Release 23.0.0.0.0 - Develop, Learn, and Run for Free
Version 23.4.0.24.05
SQL> show con_id

CON_ID
------------------------------
3
Create the scott schema:
SQL> drop user scott cascade;

SQL> create user SCOTT identified by tiger default tablespace users;

SQL> grant connect, create session, create table, create view, create sequence, create procedure, create job, to scott;

SQL> alter user scott quota unlimited on users;
Download ORDS from https://www.oracle.com/database/sqldeveloper/technologies/db-actions/download/
Download it to /u02/oracle/ords/ords_pkg wich is the /u02/oracle/ords directory in the docker container.
Connect as oracle user to the container and install ORDS:
# connect to the container
[oracle@db23ai ~]$ docker exec -u 54321 -it 23ai /bin/bash

bash-4.4$ id
uid=54321(oracle) gid=54321(oinstall) groups=54321(oinstall),54322(dba),54323(oper),54324(backupdba),54325(dgdba),54326(kmdba),54330(racdba)

bash-4.4$ cd /opt/oracle/ords/ords_pkg
bash-4.4$ ls
ords-24.2.2.187.1943.zip

bash-4.4$ unzip ords-24.2.2.187.1943.zip
...

bash-4.4$ export JAVA_HOME=/opt/oracle/product/23ai/dbhomeFree/jdk
bash-4.4$ export PATH=$PATH:/opt/oracle/product/23ai/dbhomeFree/jdk/bin

bash-4.4$ /opt/oracle/ords/ords_pkg/bin/ords --config /opt/oracle/ords install

ORDS: Release 24.2 Production on Thu Jul 11 12:20:40 2024

Copyright (c) 2010, 2024, Oracle.

Configuration:
  /opt/oracle/ords

The configuration folder /opt/oracle/ords does not contain any configuration files.

Oracle REST Data Services - Interactive Install

  Enter a number to select the TNS net service name to use from /opt/oracle/product/23ai/dbhomeFree/network/admin/tnsnames.ora or specify the database connection
    [1] EXTPROC_CONNECTION_DATA SID=PLSExtProc
    [2] FREE         SERVICE_NAME=FREE
    [3] FREEPDB1     SERVICE_NAME=FREEPDB1
    [S] Specify the database connection
  Choose [1]: 3 <<<<<<<<<<<<< MY ENTRY <<<<<<<<<<<<<<<<
  Provide database user name with administrator privileges.
    Enter the administrator username: sys. <<<<<<<<<<<<< MY ENTRY <<<<<<<<<<<<<<<<
  Enter the database password for SYS AS SYSDBA:  Hello-World-123 <<<<<<<<<<<<< MY ENTRY <<<<<<<<<<<<<<<<

Retrieving information.
ORDS is not installed in the database. ORDS installation is required.

  Enter a number to update the value or select option A to Accept and Continue
    [1] Connection Type: TNS
    [2] TNS Connection: TNS_NAME=FREEPDB1 TNS_FOLDER=/opt/oracle/product/23ai/dbhomeFree/network/admin
           Administrator User: SYS AS SYSDBA
    [3] Database password for ORDS runtime user (ORDS_PUBLIC_USER): <generate>
    [4] ORDS runtime user and schema tablespaces:  Default: SYSAUX Temporary TEMP
    [5] Additional Feature: Database Actions
    [6] Configure and start ORDS in Standalone Mode: Yes
    [7]    Protocol: HTTP
    [8]       HTTP Port: 8080
    [A] Accept and Continue - Create configuration and Install ORDS in the database
    [Q] Quit - Do not proceed. No changes
  Choose [A]:   <<<<<<<<<<<<< MY ENTRY <<<<<<<<<<<<<<<<
  .....
2024-07-11T12:23:05.339Z INFO        Oracle REST Data Services initialized
Oracle REST Data Services version : 24.2.2.r1871943
Oracle REST Data Services server info: jetty/10.0.21
Oracle REST Data Services java info: Java HotSpot(TM) 64-Bit Server VM 11.0.23+7-LTS-222

<<<< ORDS is running in foreground. Press ^C to stop it once installed
^C


bash-4.4$
Once installed stop the ords server to configure it for mongodb:
# in the container as oracl user
bash-4.4$ /opt/oracle/ords/ords_pkg/bin/ords --config /opt/oracle/ords config set mongo.enabled true

ORDS: Release 24.2 Production on Thu Jul 11 12:25:09 2024

Copyright (c) 2010, 2024, Oracle.

Configuration:
  /opt/oracle/ords

The global setting named: mongo.enabled was set to: true

# start the ords server
bash-4.4$ /opt/oracle/ords/ords_pkg/bin/ords --config /opt/oracle/ords serve

ORDS: Release 24.2 Production on Thu Jul 11 12:25:51 2024

Copyright (c) 2010, 2024, Oracle.

Configuration:
  /opt/oracle/ords

2024-07-11T12:25:53.083Z INFO        HTTP and HTTP/2 cleartext listening on host: 0.0.0.0 port: 8080
....
2024-07-11T12:25:53.170Z INFO        The Oracle API for MongoDB connection string is:
         mongodb://[{user}:{password}@]localhost:27017/{user}?authMechanism=PLAIN&authSource=$external&ssl=true&retryWrites=false&loadBalanced=true
2024-07-11T12:25:58.362Z INFO        Configuration properties for: |default|lo|
awt.toolkit=sun.awt.X11.XToolkit
db.tnsAliasName=FREEPDB1
...
If the configuration is correct the mongo shell URI is printed: 2024-07-11T12:25:53.170Z INFO The Oracle API for MongoDB connection string is:
mongodb://[{user}:{password}@]localhost:27017/{user}?
Connect as scott to the PDB and enable the schema for ORDS usage:
oracle@db23ai ~]$ sqlplus scott/tiger@localhost:1700/freepdb1

-- Enable SODA_APP role to work with JSON collections.
SQL> grant soda_app to scott;

SQL> exec ORDS.ENABLE_SCHEMA;

PL/SQL procedure successfully completed.
Now connect to Oracle database using mongosh:
[oracle@db23ai ~]$ export URI='mongodb://scott:tiger@localhost:27017/freepdb1?authMechanism=PLAIN&authSource=$external&tls=true&retryWrites=false&loadBalanced=true'

[oracle@db23ai ~]$ mongosh  --tlsAllowInvalidCertificates $URI
Current Mongosh Log ID:	668fd0b81156f2c04b482f8a
Connecting to:		mongodb://<credentials>@localhost:27017/freepdb1?authMechanism=PLAIN&authSource=%24external&tls=true&retryWrites=false&loadBalanced=true&serverSelectionTimeoutMS=2000&tlsAllowInvalidCertificates=true&appName=mongosh+2.2.12
Using MongoDB:		4.2.14
Using Mongosh:		2.2.12

For mongosh info see: https://docs.mongodb.com/mongodb-shell/


To help improve our products, anonymous usage data is collected and sent to MongoDB periodically (https://www.mongodb.com/legal/privacy-policy).
You can opt-out by running the disableTelemetry() command.

freepdb1>
Let’s create a collection:
freepdb1> use scott

scott> db.createCollection('emp_mdb');

scott> db.emp_mdb.insertOne({"name":"Miller","job": "Programmer","salary": 70000});
{
  acknowledged: true,
  insertedId: ObjectId('668fd349ec28de3a61482f8d')
}

scott> db.emp_mdb.find({"name":"Miller"});
[
  {
    _id: ObjectId('668fd349ec28de3a61482f8d'),
    name: 'Miller',
    job: 'Programmer',
    salary: 70000
  }
]

# remark the table name in lowercase
scott> show collections
emp_mdb
Let’s check the collection table from Oracle sqlplus point of view:
# connect to the PDB
[oracle@db23ai ~]$ sqlplus scott/tiger@localhost:1700/freepdb1

SQL>
-- describe the MongoDB collection stored as a table
SQL> desc emp_mdb;
 Name					   Null?    Type
 ----------------------------------------- -------- ----------------------------
 DATA						    JSON

-- select the collection
SQL> select * from emp_mdb;

DATA
--------------------------------------------------------------------------------
{"_id":"668fd349ec28de3a61482f8d","name":"Miller","job":"Programmer","salary":70


-- check the tables from scott schema (the collection is in lowercase ;) )
SQL> select table_name from user_tables;

TABLE_NAME
--------------------------------------------------------------------------------
DEPT
EMP
BONUS
SALGRADE
emp_mdb


-- print JSON fields a human readable
SQL> select json_serialize(dbms_json_schema.describe(object_name=>'emp_mdb', owner_name  => 'SCOTT') pretty) as json_schema;

JSON_SCHEMA
--------------------------------------------------------------------------------
{
  "title" : "emp_mdb",
  "dbObject" : "SCOTT.emp_mdb",
  "type" : "object",
  "dbObjectType" : "table",
  "properties" :
  {
    "DATA" :
    {
    }
  },
  "dbPrimaryKey" :
  [
    "RESID"
  ]
}

--  print them more pretty
SQL> select json_serialize((e.data) pretty) from emp_mdb e;

JSON_SERIALIZE((E.DATA)PRETTY)
--------------------------------------------------------------------------------
{
  "_id" : "668fd349ec28de3a61482f8d",
  "name" : "Miller",
  "job" : "Programmer",
  "salary" : 70000
}
Integrating MongoDB documents into an Oracle database enables organizations to take advantage of the unique strengths of both databases. This hybrid approach supports flexible, scalable, and robust data management, catering to a wide range of business needs. By following the steps outlined in this blog, you can create a seamless integration that leverages the best of both worlds.
Embrace the hybrid model and unlock new potentials in your data architecture.
L’article Integrating MongoDB Documents in Oracle Database: A Modern Approach to Hybrid Data Management est apparu en premier sur dbi Blog.